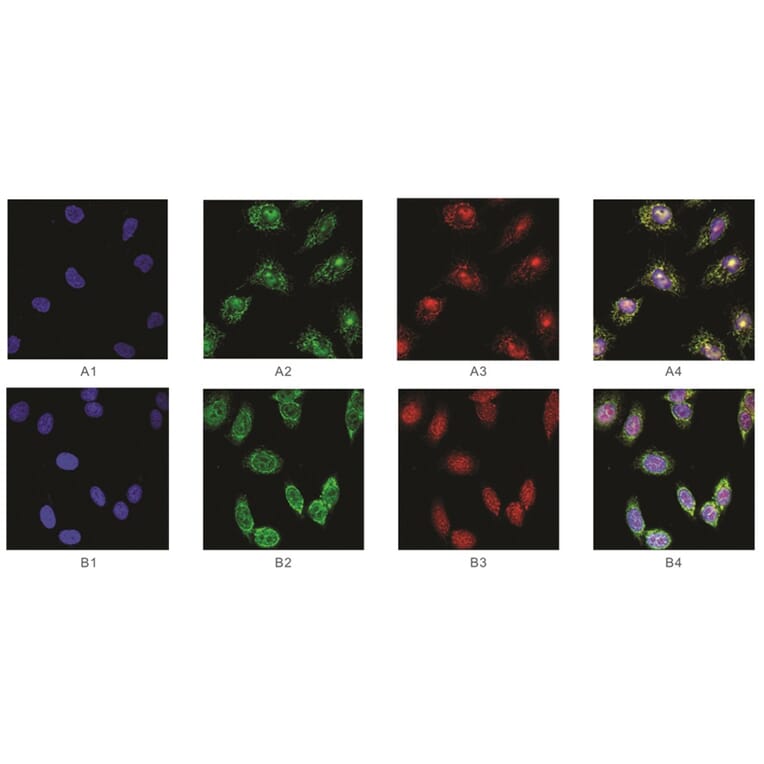
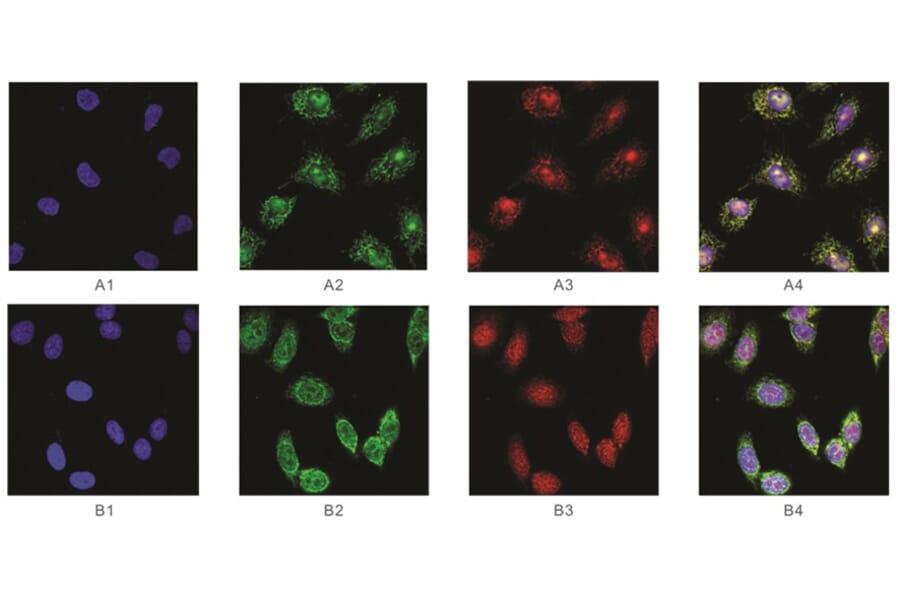
Immunofluorescence (IF) staining of HepG2 and L02 cells double stained with Anti-SAH Antibody (AF488) (#MAF00301) at 40 µg/ml and MAF00201 at 8 µg/ml followed by DAPI staining and photographed under the laser scanning confocal miscroscope (Zeiss LSM 78). (A1-A4) Normal liver cell line L02 cells cultured in RPMI 1640 with 10% FBS for 40h. Different views are as follows: DAPI (A1); AF488 for SAH (2); AF647 for SAM (A3); Overlap of all the three fluorescent signals (A4). (B1-B4) Hepatocellular carcinoma cell line HepG2 cells cultured for 40h. Different views are follows: DAPI (B1); AF488 for SAH (B2); AF647 for SAM (B3); Overlap of all the three fluorescent signals (B4). Expression patterns of SAM and SAH are different between L02 and HepG2 cells (x630).
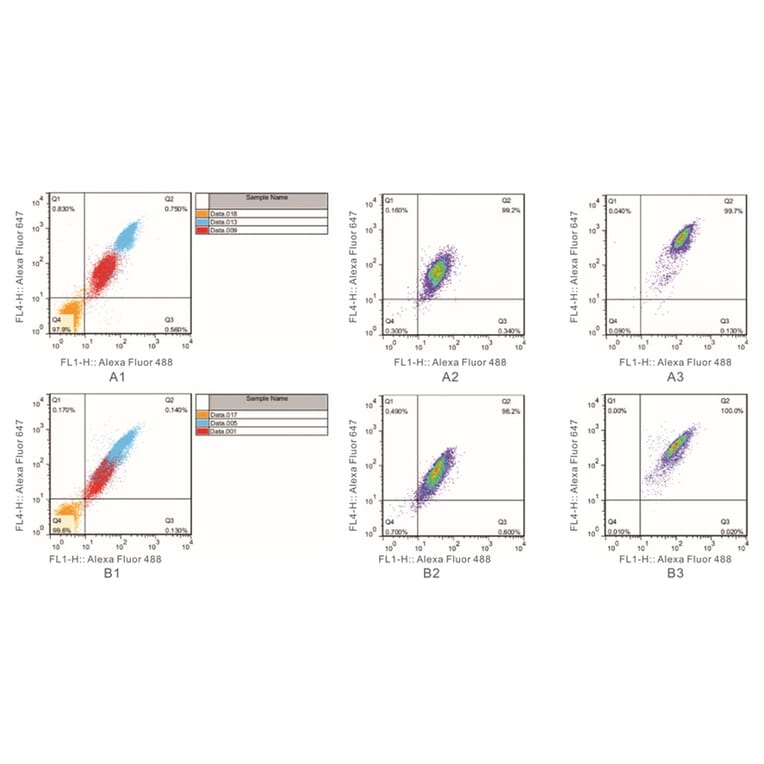
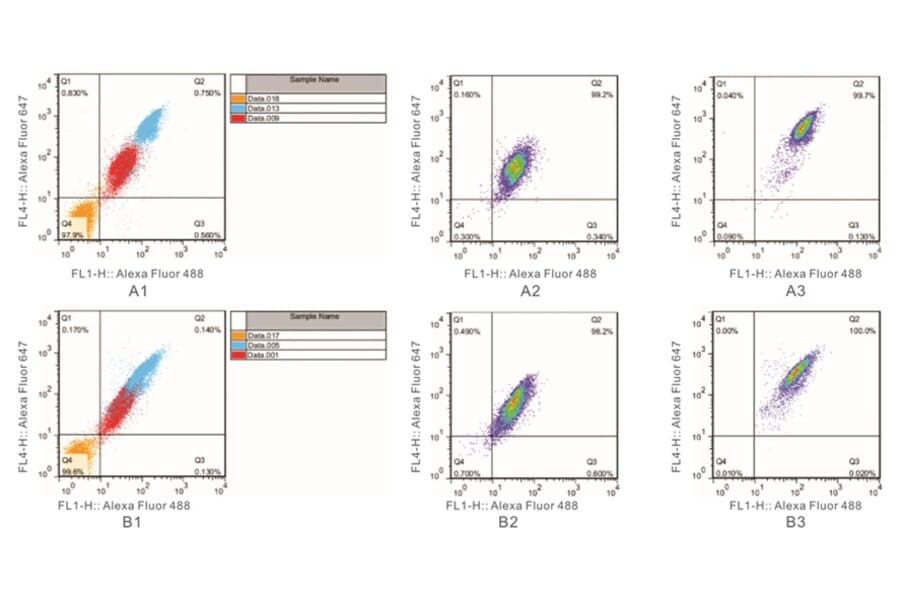
Flow Cytometry of L02 (A1-A3) and HepG2 (B1-B3) cells double stained with MAF00301 at 36 µg/ml and MAF00201 at 4.5 µg/ml. Colour legend: Orange: blank; Blue: Nuclear fixation / permeabilisation buffer was used (eBioscience 00-5523 FoxP3_TF Staining Buffer Set); Red: Intracellular fixation / permeabilisation buffer was used (eBioscience 00-8824). 100% confluent cells (cultured in RPMI 1640 with 10% FBS for 48h) were fixed and permeabilised with the intracellular fixation / permeabilisation buffer (A2, B2) or the nuclear fixation / permeabilisation buffer (A3, B3) and then double stained with the antibodies indicated above. Cells were used for analysis with BD FACS Calibur Flow Cytometer. SAM expression is higher in L02 than HepG2 cells. Both SAM and SAH are expressed ubiquitously yet rather dynamically. The level of SAM is higher than that of SAH in both cells.