
Cyanine 5
Excitation: 649nm, Emission: 666nm
Background and objectives: Myasthenia gravis (MG) is an autoimmune disorder of the neuromuscular junction most commonly associated with acetylcholine receptor (AChR) antibodies (AChR-Abs), detected in up to 80% of patients. The emergence of targeted therapies, such as neonatal Fc receptor (FcRn) inhibitors, highlights the need for standardized functional assays capable of dissecting AChR-Ab pathogenic mechanisms. By selectively reducing circulating IgG through FcRn blockade, these agents differ fundamentally from conventional immunosuppressants, emphasizing the need to characterize antibody-mediated AChR dysfunction and complement activation as potential markers of therapeutic response. However, current functional assays often rely on transiently transfected or heterogeneous cell systems, limiting reproducibility and scalability. A stably transfected human cell line expressing physiologically clustered adult AChRs could fill this methodological gap and enable standardized, quantitative evaluation of antibody effector functions.
Methods: We generated a stable rhabdomyosarcoma (RD) cell line expressing clustered human adult AChRs (hAChR-RDcl) using the PiggyBac transposon system for genomic integration of AChR subunit genes. The hAChR-RDcl line was applied to functional cell-based assays using serum samples from 30 patients with AChR-MG before and after one treatment cycle with efgartigimod. Clinical efficacy was assessed by Quantitative Myasthenia Gravis (QMG) and MG Activities of Daily Living (MG-ADL) scores.
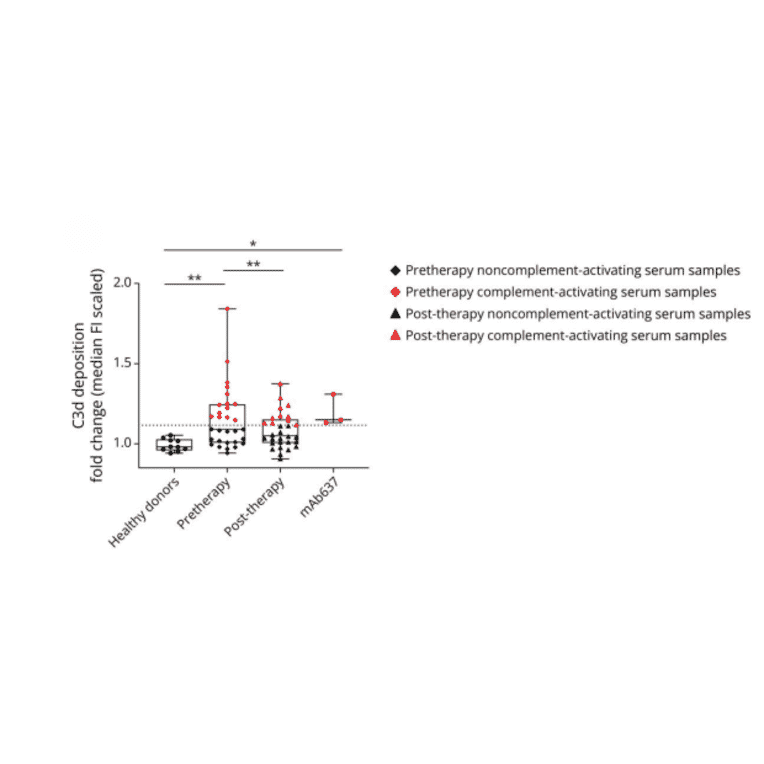
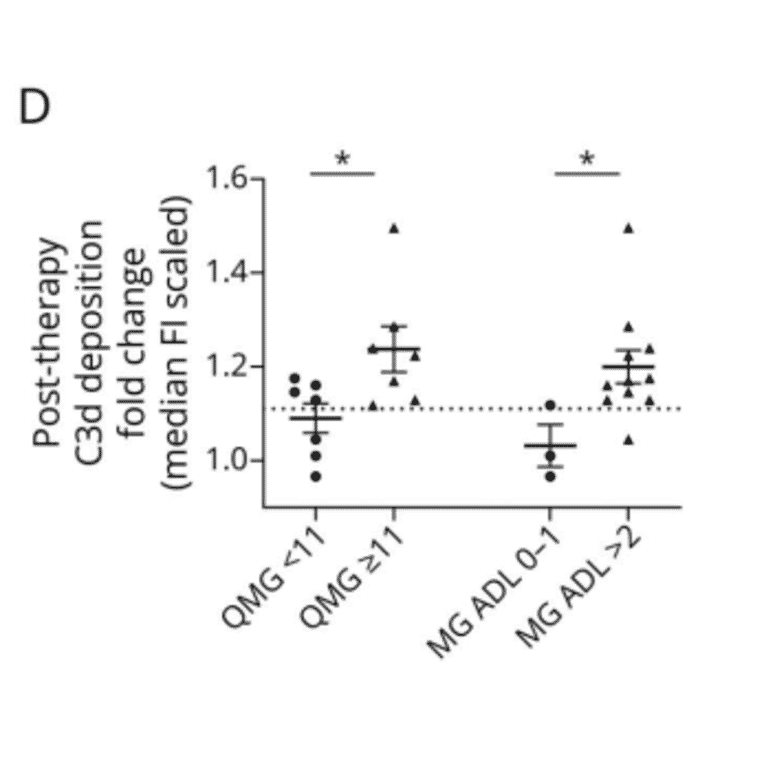
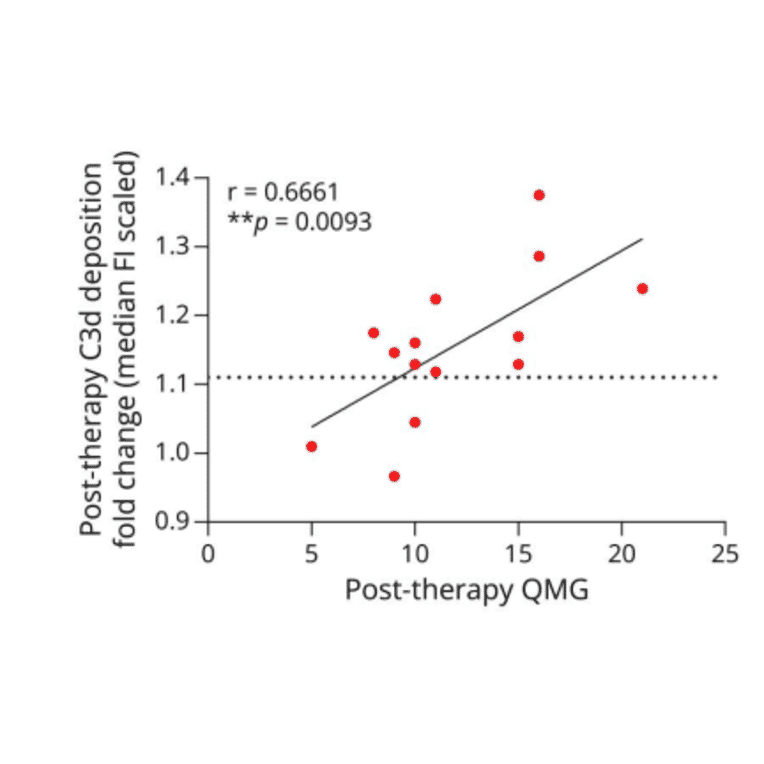
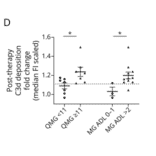
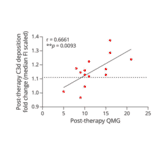
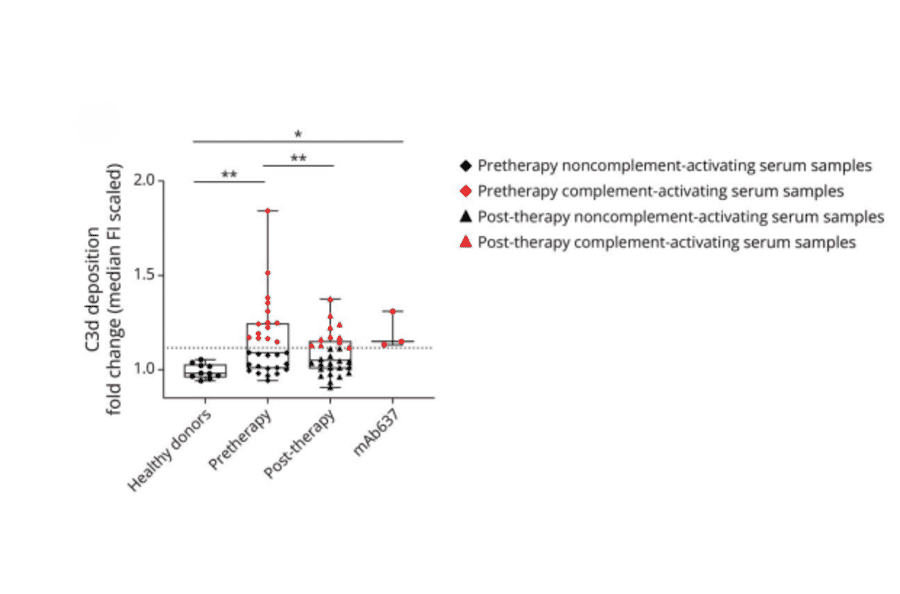
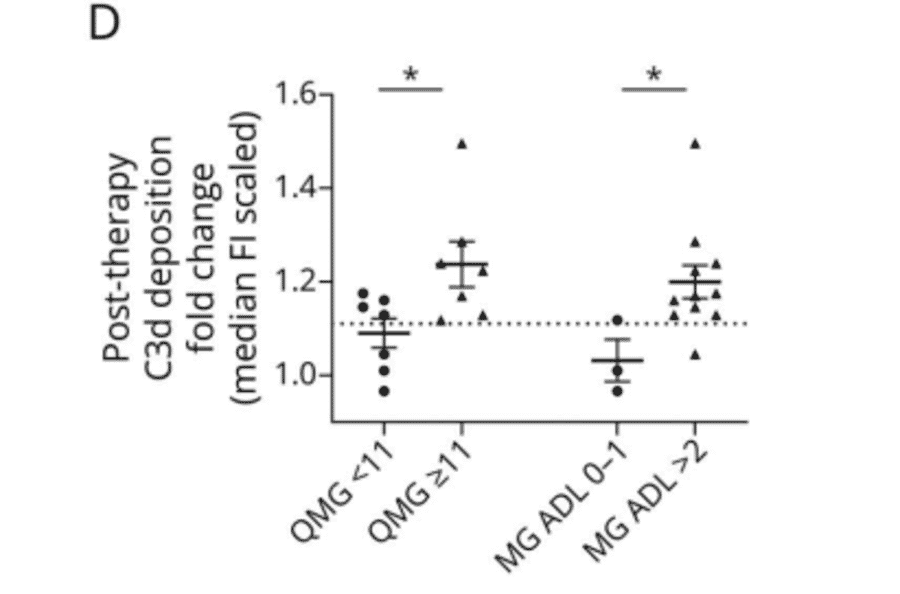
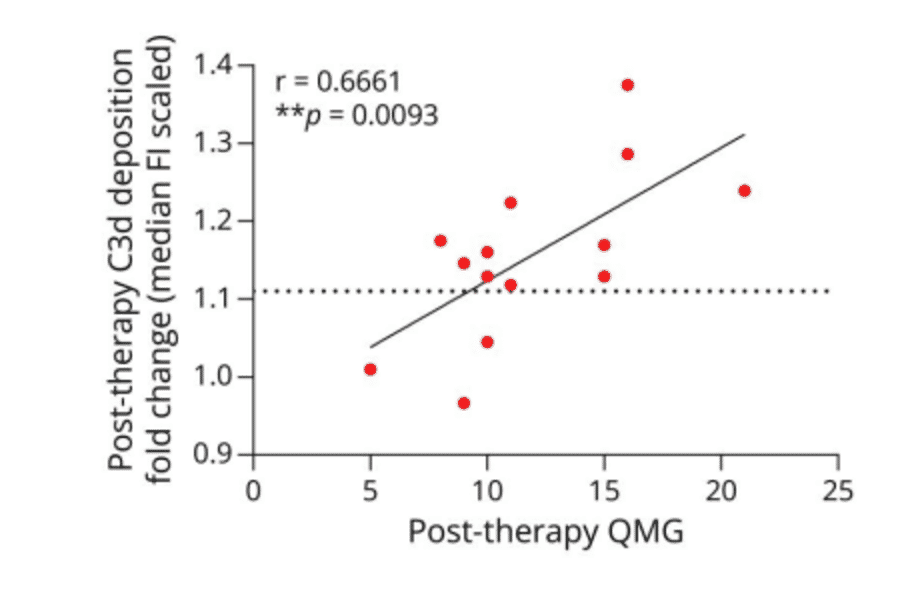
Results: The hAChR-RDcl cell line showed stable transcription and surface expression of adult AChR subunits, confirmed by RT-qPCR, a-bungarotoxin binding, and antibody-specific reactivity (mAb637 and patient serum samples). Baseline functional assays identified blocking antibodies in 15 of 30 (50%), internalizing antibodies in 20 of 30 (66.7%), and complement-activating antibodies in 14 of 30 (46.6%) samples. After efgartigimod treatment, all 3 antibody-mediated mechanisms were significantly reduced. Patients with persistent complement activity after treatment experienced more severe symptoms (higher QMG scores) compared with those showing other antibody-mediated pathogenetic mechanisms or complete suppression of antibody effector functions.
Discussion: The hAChR-RDcl cell line represents a reliable and scalable platform for standardized functional profiling of AChR-Abs. Functional characterization of AChR-Abs provides a translational approach to monitor therapeutic responses and elucidate the mechanisms underlying FcRn inhibitor efficacy in MG.