Immunocytochemistry-Immunofluorescence ICC-IF

The complete ICC-IF technique guide.

By Stewart Newlove, PhD and Ryan Hamnett, PhD

Immunocytochemistry (ICC) refers to the detection and visualization of antigens in cultured, immortalized and primary cells. Alongside immunohistochemistry (IHC), which involves detecting antigens in tissue samples such as brain sections or whole embryos, these techniques enable visualization of protein subcellular localization and abundance in a semi-quantitative manner (Figure 1).

Traditionally, ICC and IHC relied upon chromogenic detection whereby enzyme-conjugated antibodies generate colored precipitates visible under a light microscope. Immunofluorescence (IF), which instead uses fluorophore-conjugated antibodies, has largely succeeded colorimetric methods in many fields, thanks to the combined impact of broadening fluorophore availability and advancements in fluorescence microscopy. IF has empowered researchers to design multi-parametric experiments that are flexible and robust, with multiplex IF experiments allowing the simultaneous detection of several antigens.

This application guide aims to provide a comprehensive overview of ICC-IF experimental design, methods, optimization and troubleshooting. The critical aspects of sample preparation, detection, labeling and visualization shall be discussed in detail, providing a rationalized, flexible roadmap that can be tailored to your research objectives.

ICC vs IHC - Two rows of images depicting fluorescent IHC and ICC

Figure 1: ICC vs IHC. Both ICC and IHC are used to visualize protein targets in cells, often using fluorescence, but ICC typically involves visualizing cells in culture, while IHC views cells in their physiological context in tissue. The image above shows neural stem cells in the subventricular zone of the mouse brain (IHC; top) or in culture (ICC; bottom). Both samples are immunostained for the proliferation marker Ki67 and the astrocyte marker GFAP, and counterstained by DAPI. Reproduced with permission; Copyright © 2024, Lucy Xu, PhD.

Table of Contents

Why choose IHC/ICC?

ICC is an ideal technique to choose when experimental aims revolve around target co-localization with other proteins of interest, subcellular target localization, and expression profiles in different cell-cycle or cell-type subpopulations. It therefore has distinct advantages over related techniques, such as Western blots and enzyme-linked immunosorbent assays (ELISAs). Applications for these techniques and some key differences between them are summarized in Table 1.

ICC/IHC Western Blot ELISA
Sample Preparation Fixed cells on coverslip (ICC)

Fixed tissue sectioned or wholemount (IHC)
Lysed cells

Denatured protein
Lysed cells or tissue

Biological fluids (plasma, urine, cell culture supernatant)
Protein State In situ, but fixed Denatured Native, unfixed
Multiplex Easily up to 4 targets; more are possible through unmixing or sequential probing Fluorescent multiplexing is possible, as is sequential blotting (stripping and re-blotting the same membrane No, typically requires bead-based immunoassays for multiplexing
Can be high throughput? Yes Rarely Commonly
Sensitivity
* ability to detect low levels of target
Medium High High
Specificity
* antibody binding only the target protein
Medium High High, particularly sandwich ELISAs
Subcellular compartmentalization of proteins Highly suitable Limited to subcellular fractionation before application Limited to subcellular fractionation before application
Expression in mixed cell populations Highly suitable Limited to cell sorting before application Limited to cell sorting before application
Protein-protein interactions Limited to co-localization in cells or subcellular compartments Yes, through far-western blotting1 Yes2
Protein weight or size None Highly suitable None

Table 1:Key applications and differences between common biochemical techniques for protein detection

History of ICC

Antibodies

As the name suggests, the development of IF techniques is founded in discoveries harnessing the respective potential of antibodies and fluorescent dyes. In 1890, a seminal piece of research carried out by Behring and Kitasato observed that the serum of tetanus-infected rabbits conferred protection of naïve mice against future Clostridium tetani exposure.3 Further highlighting the therapeutic potential of what we now know to be polyclonal antibodies, Behring published a second paper demonstrating the protective capacity of serum extracted from guinea pigs immunized against diphtheria.4 Later that decade, the German physician Paul Ehrlich postulated with great prescience that the biological agents of immunity, antibodies, were produced by white blood cells and acted as receptors, binding antigens through highly specific interactions. Adapted from Emil Fischer’s enzymatic lock and key model5, Ehrlich’s side-chain theory was later validated with a few minor exceptions. Furthermore, Ehrlich’s structural vision of antibody-antigen binding were impressively predictive of the Nobel Prize winning work of Edelman and Porter in 1972.6

Fluorescence

The fluorescence phenomenon was first observed in the 16th century by a Spanish physician, Nicolas Monardes, when working with a diuretic wood extract called Lignum nephriticum. However, it was not until the mid-19th century when chemical fluorescence was catalogued in detail.7 In his landmark monograph, George Stokes accurately described fluorescence as the emission of light from a body following its excitation.8 Twenty years later, in 1871, the first synthetic dye, fluorescein, was produced by the German chemist, Adolf van Baeyer.9 Baeyer's break-through paved the way for the development of other xanthene-based dyes including rhodamine and multiple Alexa Fluor dyes still used today. Although fluorescent dyes were readily applied within the fields of human physiology and fluorescence microscopy, the advent of IF itself took place some time later.

Development of immunofluorescent dyes

In 1941, Albert Coons pioneered the use of fluorescent antibodies to visualize antigens in tissues during his studies of rheumatic fever.10 Considered the birth of IF, Coons and colleagues conjugated antibodies to Baeyer’s fluorescein dye in order to detect proteins in animal tissue sections.

Soon after, scientists considered what other fluorophores could be conjugated to proteins in order to address the limitations of fluorescein. For example, upon excitation, fluorescein emits yellow/green light overlapping with wavelengths of cellular autofluorescence. In order to visualize targets while avoiding such spectral overlap, rhodamine conjugates were made which emit longer wavelength light shifted towards the red end of the spectrum. One of the earliest success stories involved the development of rhodamine B 200 in 1958 – a dye which displayed brilliant orange fluorescence while achieving low background and high contrast with tissue autofluorescence.11 Since then, several xanthene-based dyes, members of the rhodamine family, have been developed for use in IF, including Texas Red, TAMRA, ROX and TRITC.

In the 1990s, a new wave of fluorophore development led by Alan Waggoner focused on improving dye solubility and quenching issues identified during rhodamine conjugation. However, the success of Waggoner’s cyanine dyes stretched beyond this, providing researchers with a versatile family of reagents boasting broad emission ranges.12 Structurally, cyanine dyes contain a nitrogenous heterocyclic system linked by a polymethine chain. The length of this chain can be modified to tune the spectral properties of the molecule between red and near-infra-red regions. Both cyanine and rhodamine dyes were improved further through sulfonation modifications. The addition of a negatively charged sulfonic acid group limited troublesome H-aggregates which formed during conjugation, ultimately reducing fluorescence.

Advances in fluorescence microscopy

Throughout the 1950s and 1960s, IF techniques and reagents continued to improve alongside advances in fluorescence microscopy. First built and used in 1911 by the physicist Oskar Heimstadt, fluorescence microscopes were initially purposed towards visualizing autofluorescence.13 Later versions were designed to study tissue samples injected with fluorescein, but it was the dichromatic beamsplitter instrument, invented by Johan Sebastian Ploem in 1967, which first resembled modern fluorescence assemblies.14 Containing a dichromatic mirror angled at 45 degrees, shorter wavelength radiation could be reflected from its source to excite the sample while longer wavelength, emitted fluorescence was transmitted through to the eyepiece/detector. By the late 20th century, the integration of IF with confocal microscopy and super-resolution techniques significantly improved the resolution and 3D imaging capabilities, enabling researchers to study subcellular structures with great detail.

Monoclonal antibodies

Following Coons’ milestone development of IF up to the 1970s, researchers could only conjugate new fluorophores to polyclonal antibodies. At this time, polyclonal antibodies were purified from the serum of animals immunologically challenged with an antigen of choice. Given these antibodies are being produced endogenously by a variety of B-lymphocytes, the antigen will be targeted through multiple epitopes. The non-uniform nature of polyclonal antibody production led to increased batch variability and therefore low reproducibility of immunological staining. Furthermore, background signal using conjugated polyclonal antibodies remained high due to non-specific binding events within the tissue or cell sample. In 1975, the development of monoclonal antibody production using hybridoma technology revolutionized IF. Georges Köhler, César Milstein, and Niels K. Jerne demonstrated how monoclonal antibodies against a single epitope could be produced by fusing mouse B cells with immortalized myeloma cells.15 Performed in vitro, hybridoma cells were carefully cultured so that antibodies were continuously secreted into the media. This achievement transcended the limitations of traditional polyclonal antibodies, offering a consistent supply of highly specific antibodies for various applications.16

Cell culture advances

Alongside developments in antibody production, fluorophore synthesis and fluorescence microscopy, techniques for culturing cells in vitro were subject to continuous improvement in the mid-late 20th century. While initial IF experiments in the 1950s could only visualize antigens in tissue samples, this progress in cell culture opened the door to a new application for immunological staining. ICC was developed as a variant of immunostaining specifically adapted for the study of cultured cells grown on microscope slides or coverslips. Culturing cells as monolayers in Petri dishes allowed researchers to study isolated cell populations. In contrast to original IF protocols, ICC requires a permeabilization step in order for antibodies to access intracellular targets. This was achieved using detergents or alcohols to disrupt the plasma membrane before immunostaining.16 Over time, ICC has established itself as a highly informative technique for studying single-cell biochemistry in a specific and high-throughput manner.

Next, we will set out how the key discoveries described above have informed current ICC-IF workflows, empowering researchers to design informative experiments.

ICC-IF workflow

Although ICC-IF protocols vary in the reagents used, complexity, and other parameters, they all share a simple set of objectives. The target of interest, the antigen, should be detected with great specificity, producing a bright, stable signal when visualized while minimizing background ‘noise’ generated from the staining of non-target structures. The workflow of IHC and ICC are similar; the main steps are illustrated in Figure 2, alongside variables that must be taken into account at each stage to determine the ideal experimental conditions.

The first step to achieving this strong, specific signal necessitates that antigen epitopes are preserved and suitably exposed for antibody binding. This is achieved by fixing cells with the appropriate fixative agent. Fixation promotes adherence of cells to the coverslip, maintains the structural integrity of the cell, and immobilizes cellular contents preventing antigen diffusion. When detecting nuclear chromatin-associated proteins, a pre-extraction step may be included prior to fixation. Pre-extraction helps reduce the levels of background cytoplasmic staining, boosting the signal to noise ratio (SNR) achieved during imaging. After fixation, the plasma membrane must be permeabilized to permit entry of the antibody into the cell. Next, coverslips are incubated with a blocking solution to prevent the non-specific binding of antibodies and other detection molecules to the sample. Analogous to the step performed during immunoblots, blocking reduces background signal, maximizing the number of specific antibody binding events and increasing the sensitivity of the assay.

Blocked samples are now ready to undergo immunostaining to detect and label the antigen of interest. The sequence and complexity of this step depends on whether the antigen is being detected alone or in multiplex, and whether direct or indirect staining methods are preferred. Between and after each antibody incubation, samples are washed extensively to remove unbound antibody and any residual buffer. Next, washed samples are counterstained to visualize relevant cellular compartments of interest. Nuclei are labelled with DNA-binding dyes whereas cellular architecture can be demarcated using phalloidin, an actin-binding fluorescent dye. Finally, coverslips are mounted on to glass slides using an appropriate medium to preserve the fluorescence signal and protect the sample for microscopy and imaging during storage.

Overview of Immunocytochemistry, including sample preparation, pre-processing, immunostaining and visualization

Figure 2: Generalized protocol for ICC-IF

Sample preparation

Cell Preparation

ICC methods are devised for the study of cultured primary cells as well as established cell lines. The first step of sample preparation involves the application of cells onto sterilized glass coverslips or slides. For adherent cell lines in monolayer culture, coverslips are placed in Petri dishes or other tissue culture-treated vessels. Cells are then seeded directly into growth media and incubated overnight to facilitate adherence. If cells are normally grown in suspension, these must be collected and concentrated on to coverslips/slides immediately before fixation. This can be achieved through smear preparations or the use of a cytocentrifuge. To perform a smear preparation, cells are pipetted across coverslips forming a thin film which, upon drying, adheres cells to the surface. Cytocentrifuges are specialized centrifuges that deposit a monolayer of cells onto a glass slide. These strategies can also be utilized to study mitotic sub-populations of otherwise adherent cells. During mitosis, cells become loosely attached to their substrate allowing them be easily dislodged in a “mitotic shake-off” step. Now in suspension, these cells can be concentrated and applied to coverslips/slides.

Coating coverslips

Many cell lines do not adhere strongly to coverslips during sample preparation. To avoid cells becoming dislodged easily during sample processing, coverslips are often treated with a super-adhesive coating matrix (Figure 3). Fibronectin is a popular coating choice, particularly for primary cultures, due to its endogenous role in cell adherence. Produced by a wide variety of mesenchymal and epithelial cells, fibronectin interacts with cell surface receptors to activate signaling pathways linked with cell survival, migration and differentiation. Alternatively, coverslips may be coated in poly-D- or poly-L-lysine, positively charged polypeptides that bind cell membranes through electrostatic interactions. Suited to a variety of cell types, poly-D- and poly-L-lysine represent flexible choices for basic cell attachment. Other matrices including laminin, collagen or gelatin may be used depending on the characteristics of cells being examined. For example, laminin is preferred for embryonic stem cells, collagen for primary keratinocytes, and gelatin for microvascular endothelial cells.

Effects of different coverslip coating substrates on ICC outcome - 6 panel image depicting ICC-IF

Figure 3: Coverslip substrate affects cell growth. Cells from the prostate cancer cell line LNCaP were grown for 96 h on glass coverslips without a substrate (control) or coated with fibronectin (FN), laminin (LAM), poly-L-lysine (PLL), poly-L-ornithine (PLO), or collagen type IV (COL IV). Cells were then fixed and stained for F-actin with rhodamine-phalloidin and counterstained with DAPI. Note the varying cell density and morphology with coverslip substrate.

Edited and reproduced under Creative Commons 4.0 CC-BY from Liberio et al., Differential Effects of Tissue Culture Coating Substrates on Prostate Cancer Cell Adherence, Morphology and Behavior. PLOS ONE 9, e112122 (2014).

(Optional) Pre-extraction

Before fixation, a pre-extraction step is sometimes required to clear the cell of unwanted cytoplasmic and nucleoplasm contents which would otherwise mask desired antibody-antigen interactions. Typically, this step is included when labeling nuclear proteins which form foci following their recruitment to chromatin. Performing pre-extraction significantly reduces cytoplasmic and nuclear staining, simultaneously decreasing unwanted background and increasing the specificity and sensitivity of labeling events. Pre-extraction may also be used when labeling proteins which are highly abundant in the cell. For example, ICC-IF procedures targeting tubulin and actin may incorporate pre-extraction to avoid excessive staining. The desired level of pre-extraction can be tuned by altering the detergent content of buffers along with the sample incubation time. The simplest pre-extraction buffers for cytoplasmic contain detergents such as Triton X-100 (0.1 - 0.5%), NP-40 (0.1 – 1%) and digitonin (5-50 ug/ml). Cytoskeletal (CSK) and PTEMF buffers represent popular choices for pre-extraction. Both buffers aim to remove soluble cytoplasmic contents while preserving the structural integrity of the cytoskeleton and nucleus. Notably, PTEMF contains the fixative agent formaldehyde allowing pre-extraction and fixation steps to be performed through a single incubation. This is particularly useful when handling mitotic cells or cell types that could be easily detached from coverslips.

Fixation

Samples are fixed in order to preserve the structural integrity of cells, including that of the target antigen. Categorized either as crosslinking or precipitative agents, fixatives work to halt cellular biochemistry in a steady state by preventing the autolytic degradation of cellular contents by proteases and enhancing the mechanical strength of cell structure. This includes maintaining proper cell morphology as well as critical interactions between proteins, RNA and DNA.

Fixation is an essential step in IHC, because it preserves tissue integrity and morphology, prevents cellular degradation, and maintains the antigenicity of the target molecules. Sample preparation goes hand-in-hand with fixation, and will determine how the tissue will be sectioned (if at all) and handled, which fixatives are suitable, which kinds of visualization and imaging are possible, and how the tissue is stored.

Precipitative fixatives

Organic solvents such as methanol and acetone can be used to fix cells during ICC-IF by dehydrating cells, denaturing internal structures and precipitating proteins. Both agents simultaneously permeabilize cell membranes, removing the need for this step later on. Methanol fixation is rapid and is commonly used to preserve cell-surface antigens. In contrast to methanol, which primarily precipitates proteins, acetone mainly dehydrates cells, causing more severe damage to cellular structures. Both methanol and acetone can cause significant cell shrinkage and loss of antigens by removing small molecules and dissolving membrane lipids. Despite these limitations, the use of organic solvents may be necessary to fix samples containing aldehyde-sensitive probes. Standard precipitative fixation uses ice-cold methanol (100%) or acetone (100%) for 10-20 minutes at 4˚C. Other protocols may use a mixture of methanol: acetone in equal parts (1:1).

Permeabilization

Permeabilization is a critical step in ICC-IF when targeting intracellular antigens including plasma membrane-associated proteins whose epitopes are oriented towards the cytoplasmic side of the lipid bilayer. Detergents contained within the permeabilization buffer form pores in plasma and organelle membranes, disrupting their integrity and granting antibodies access to the antigen of interest.

Depending on the sub-cellular location of the antigens, different detergents may be preferable to others. Triton X-100 (0.1-0.5 %) solutions are most common due to their ability to access nuclear, cytoskeletal, and membrane-associated antigens. NP-40 (0.1-0.5%) represents a reasonable alternative to Triton X-100 since it has similar potency and facilitates access to the same variety of intracellular proteins. In situations where milder permeabilization is required while still permitting antibody access, protocols may include the use of CHAPS, saponin or digitonin. The use of CHAPS-based buffers (0.1-0.5%) is particularly effective in extracting membrane-associated proteins while preserving membrane integrity.

Permeabilization incubations are typically performed at 4˚C for 5-15 minutes. During optimization of this step, it can be helpful to observe samples under a phase contrast microscope where detergent action can be tracked in real-time. Insufficient permeabilization will prevent antibody entry whereas excessive use of detergents or longer incubation times can lead to antigen redistribution, antigen degradation and loss of cell morphology, all of which increase background signal.

Blocking

A blocking step is required to limit fluorescence produced from non-specific antibody binding events, otherwise known as false positives. As with many stages of the ICC-IF workflow, a variety of blocking buffers can be used to similar effect, but optimization is necessary to achieve the best results.

The main consideration here is that non-specific interactions can be limited with minimal impact on true antibody-antigen binding events. The ‘gold standard’ of blocking solutions should contain 5-10% solution of serum taken from the same species in which the secondary antibody was raised. In place of blood serum, other blocking solutions may contain bovine serum albumin (1-10%) or fetal bovine serum (1-10%).

Non-ionic detergents are also required to facilitate entry of the blocking buffer and reduce non-specific hydrophobic interactions within the cells. Tween-20 (0.05-0.2%) or Triton X-100 (0.1-0.5%) are suitable choices in this regard.

Primary antibodies

After blocking, samples are incubated in antibody solutions for immunolabeling. Incubation time and temperature, as well as antibody dilution and diluent should all be optimized to achieve a high SNR. All incubations are carried out in a humidified chamber – a sealed container wrapped or lined with absorbent material soaked in water. The moisture generated in the container prevents antibodies from drying out, maintaining reproducibly optimal binding conditions. Ideally the humidified chamber is also opaque or wrapped in foil to render it light-tight, important for incubations with a fluorophore-conjugated antibody.

Samples are incubated with primary antibody solutions for 3 hours at room temperature or 16 hours (overnight) at 4°C. Solutions typically include bovine serum albumin (BSA) to reduce non-specific interactions, and a detergent such as Triton X-100 or Tween-20. The best primary antibodies will detect antigens with a high degree of specificity, binding only to their target with little interaction with other cellular components. The following factors should be taken into account when selecting an antibody:

Reactivity

Antibodies recognize antigens from particular species, which will be the species that the immunizing antigen used to produce the antibody was originally from, in addition to closely related species. Antibody datasheets will typically list the species in which an antibody will recognize the antigen; this list may not be comprehensive though. For other species, researchers can empirically determine this or use protein sequence homology for reactivity prediction.

Host

The host is the species that the antibody was raised in, which is essential to know for indirection detection methods (see Direct vs indirect staining) because secondary antibodies are directed against the host species of primary antibodies, as illustrated in Figure 5. For simultaneous, indirect detection protocols (see Multicolor staining), primary antibodies should not be from the same host organism, as this will lead to cross-reactivity from secondary antibodies.
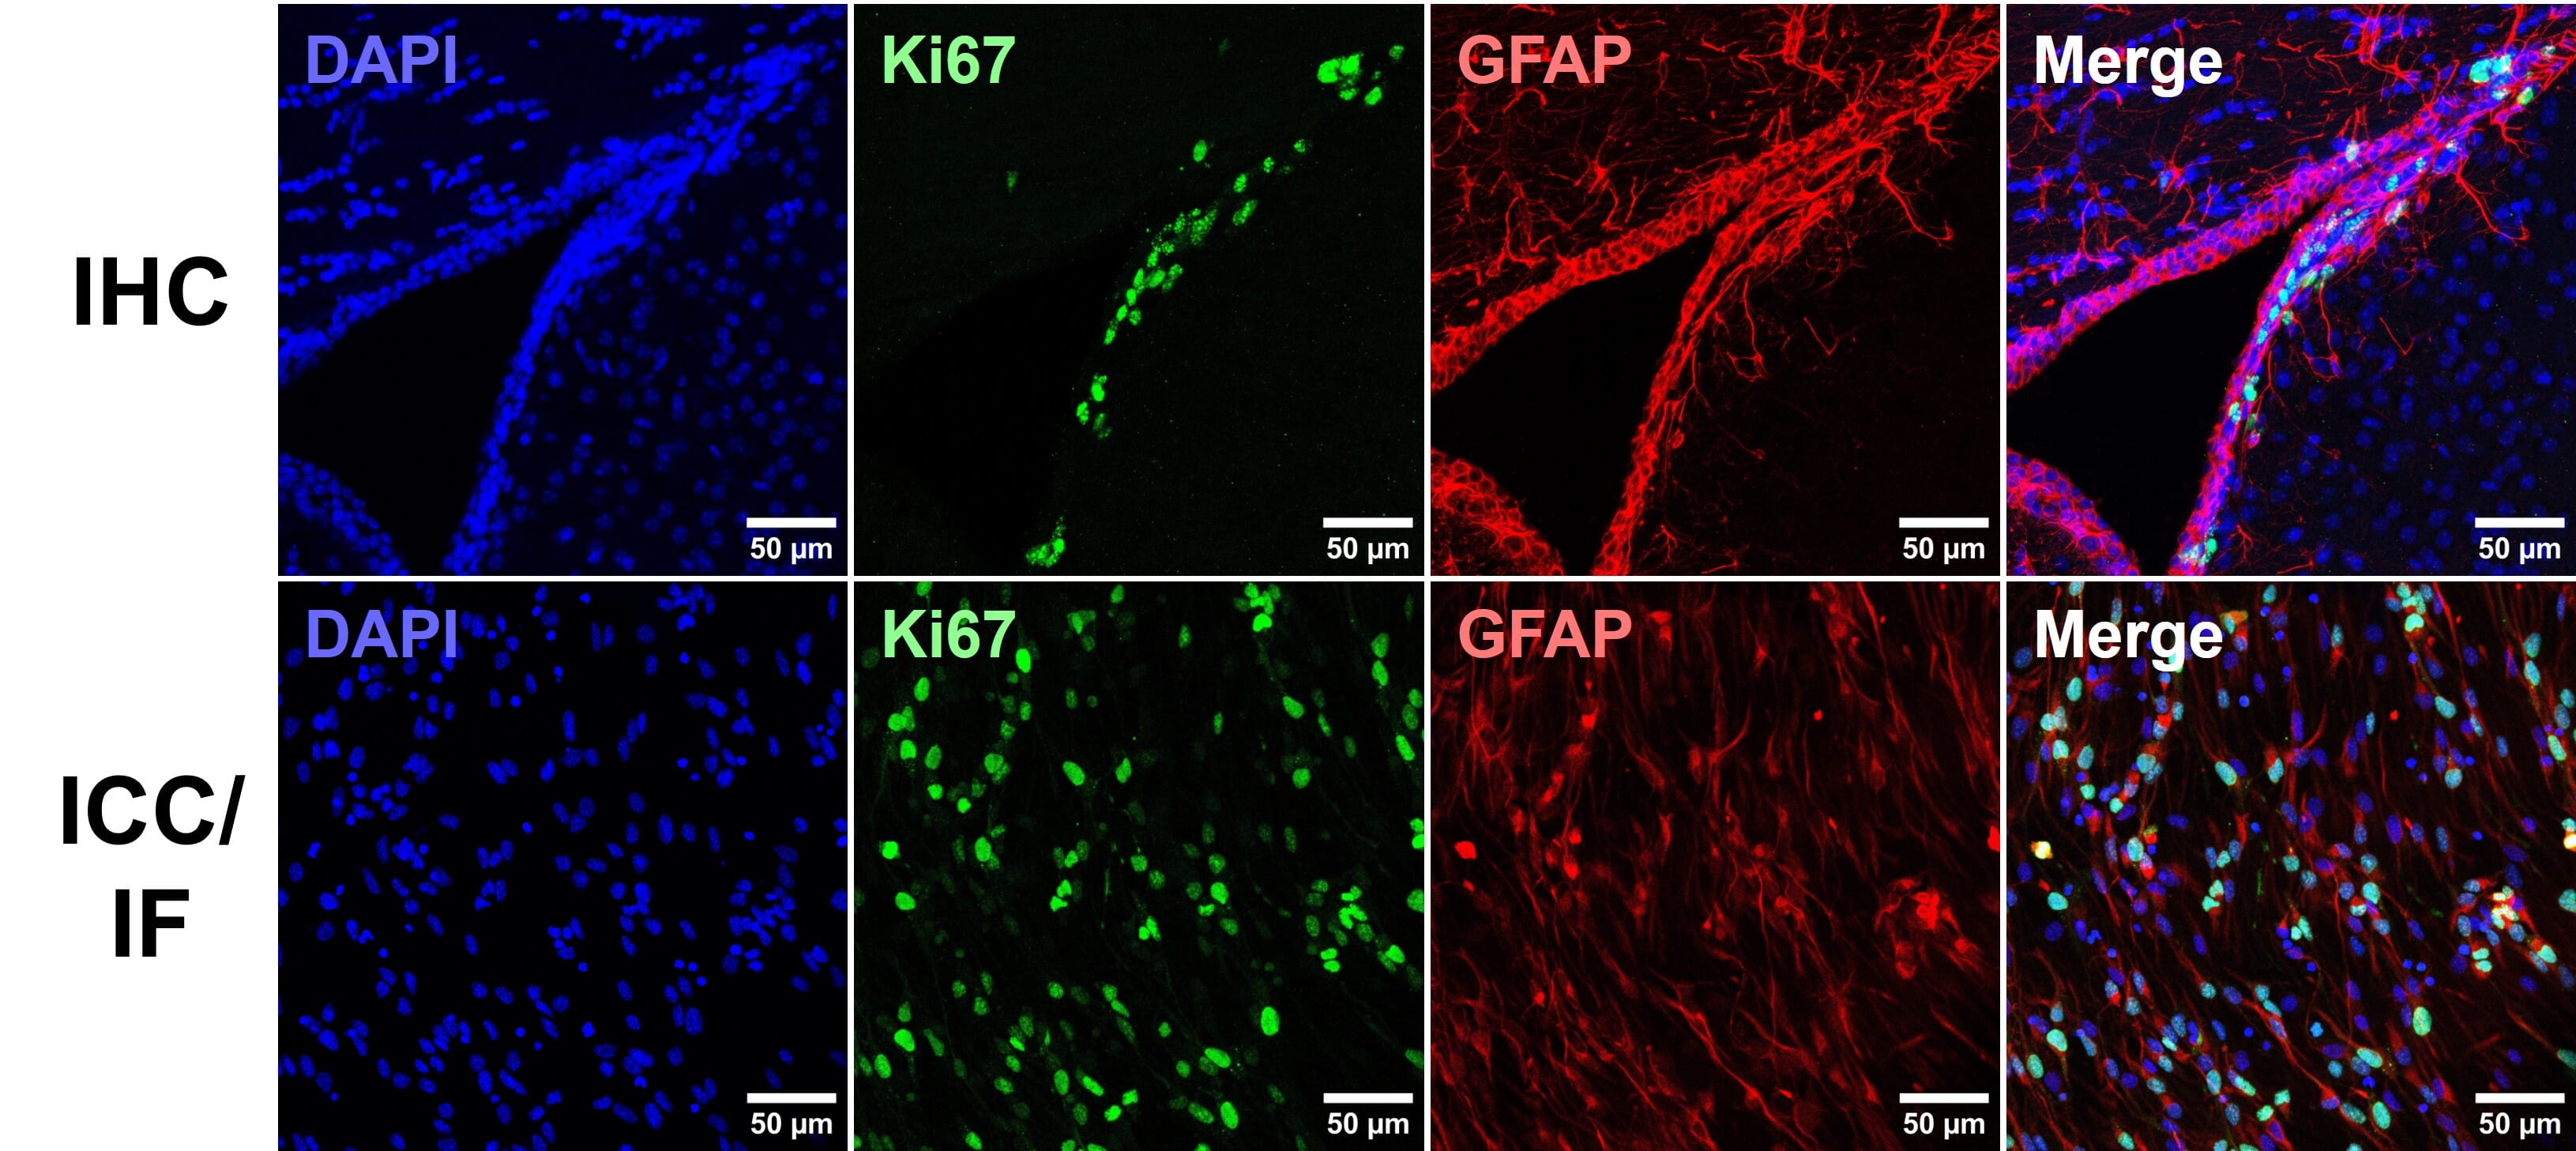
Diagram of multiplexed ICC-IF, showing fluorophore-conjugated secondary antibodies recognizing primary antibodies from different host species

Figure 5: Multiplexed staining with ICC-IF. Multiple antigens can be detected simultaneously by using primary antibodies raised in different species. Secondary antibodies will then recognize primary antibodies from a given species, and can be resolved under a fluorescence microscope through conjugation to spectrally distinct fluorophores.

Clonality

Antibodies can be monoclonal, which target a single epitope on a target protein, or polyclonal, which recognize multiple epitopes. Monoclonal antibodies typically result in lower background signal because they are less likely to recognize non-target molecules, but they may not be robust to conformational changes in the antigen following sample fixation. In contrast, because polyclonal antibodies target multiple epitopes, some epitopes may still be accessible even after conformational change.

Polyclonal antibodies also have the advantage of being produced in a wide variety of organisms, including rat, goat, guinea pig and chicken, making multiplexing (see Multicolor staining) more feasible. Many monoclonals are available only from mice, though other species are now commercially available.

Application validity

Antibodies are validated for specific applications. Those that work for western blot will not necessarily work for ICC-IF, due to different reaction conditions and protein conformations. However, if available antibody options are limited, trialing different experimental conditions with a non-validated antibody can still yield valuable data.

Labeling and detection

Selecting the correct labeling strategy is critical to achieve immunostaining with a high SNR. Even with fully optimized fixation, permeabilization and blocking steps, use of inappropriate detection parameters can still significantly compromise results. Here we shall discuss the advantages and disadvantages of different labeling regimens, incubation conditions, and fluorophore choices to inform an experimental design that is compatible with your antigen(s) of interest and overall research objectives.

Direct vs indirect staining

Immunolabeling in ICC-IF requires the specific localization of fluorophore-conjugated antibodies to the antigen of interest with limited off-target binding events. This can be achieved through direct or indirect detection methods (Figure 6).

Diagram of direct, indirect, and amplified ICC-IF

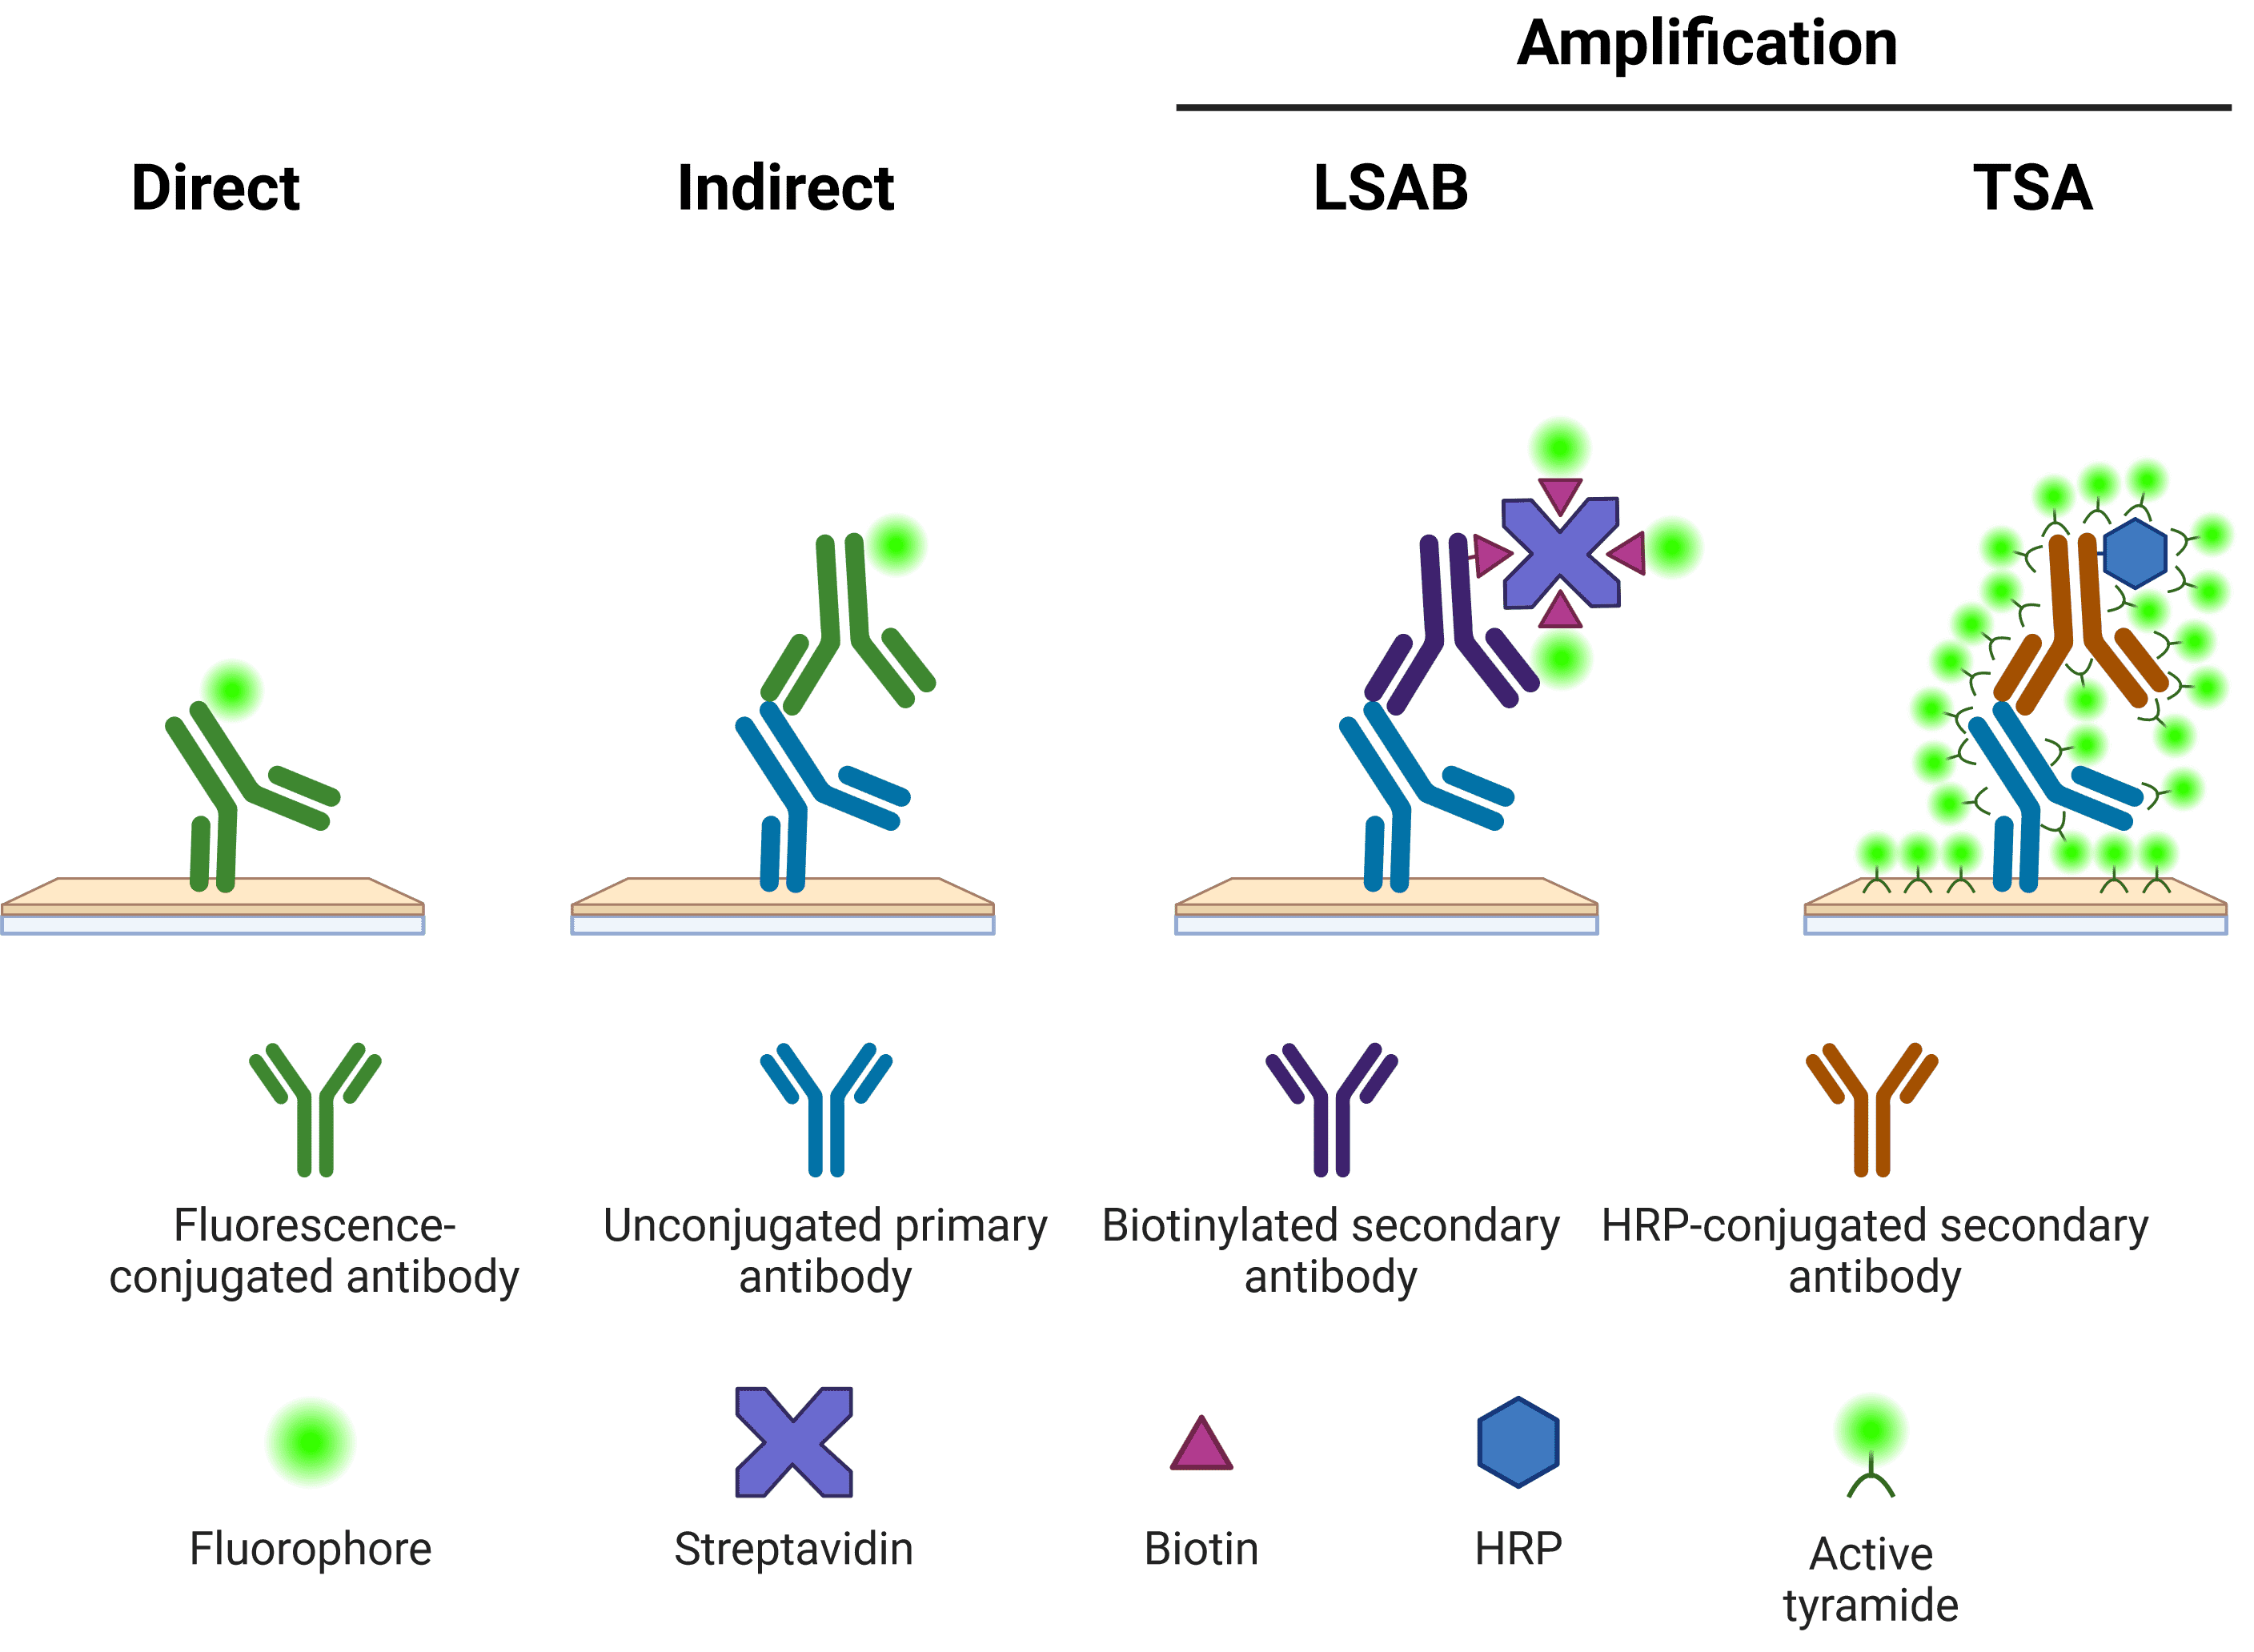
Figure 6. Schematic representation of different methods of target detection. Methods of amplification include the labeled streptavidin-biotin (LSAB) and tyramide signal amplification (TSA) systems.

Direct detection involves the use of primary antibodies directly conjugated to fluorophores for visualization of proteins in a single-step. This method is favored when dealing with high-abundance antigens where a bright, specific signal can be produced without the need for signal amplification.

Using indirect detection, the antigen-bound primary antibody is detected by a fluorophore-conjugated secondary antibody raised against the host species and isotype of the primary antibody. Since multiple secondary antibody molecules are able to bind a single primary antibody, the fluorescence signal for a single antigen detection event is amplified compared with direct methods. This approach increases the sensitivity of the assay, but it is also associated with increased background staining and care must be taken to avoid cross-reactivity between primary and secondary antibodies. Secondary antibody should be carried out in the dark using the same dilution buffer as for the primary incubation.

The advantages and disadvantages of direct and indirect detection strategies are summarized in Table 2 below:

Direct Indirect
Time Shorter Longer
Cost Conjugated primary antibodies are more expensive Non-conjugated primary antibodies are cheaper, and secondary antibodies are less expensive than primary antibodies. Secondary antibodies are cost effective as they can be used with multiple primary antibodies.
Complexity Single-step process Added complexity due to use of the appropriate secondary antibody.
Flexibility Experimental design limited by availability of commercial conjugated primary antibodies. Multiplexing can be easier though because primary antibodies from the same host species can be used together. Greater variety of conjugated secondary antibodies. The same secondary antibodies can be used against multiple primary antibodies from the same host species.
Sensitivity Weaker signal, but lower background. Brighter signal due to secondary amplification.
Species cross-reactivity Species cross-reactivity is minimized Risk of secondary antibodies cross-reacting and binding primary antibodies raised in a species other than the intended target.

Table 2:Features of direct and indirect ICC-IF.

For the detection of antigens known to be in very-low abundance, signal amplification can be enhanced further using biotin-conjugated secondary antibodies (e.g. labeled streptavidin-biotin (LSAB) system) or tyramide signal amplification (TSA). In LSAB, after binding to the primary antibody, biotinylated secondary antibodies are incubated with fluorophore-conjugated streptavidin molecules, resulting in multiple fluorophores per secondary antibody. In the TSA system, a horseradish peroxidase (HRP) enzyme is conjugated to the secondary antibody, which in turn catalyzes the conversion of labeled tyramide to a reactive radical, which binds nearby tyrosine residues. Both systems provide an extra layer of signal amplification and assay sensitivity. The trade-off with amplification systems concerns the increased processing time when performing multiple incubations in sequence.

Multicolor staining

For indirect detection of multiple colors, termed ‘multiplexing’, the immunolabeling of different antigens can be performed simultaneously or in sequence. As outlined below, simultaneous labeling involves primary and secondary antibody solutions containing the relevant antibodies for all targets. For sequential labeling, primary and secondary incubations are performed to label the first target antigen, with an intermediate blocking step before immunolabeling the second target antigen.

Simultaneous: Blocking 🠆 1st and 2nd target Primary incubation 🠆 1st and 2nd target primary incubation

Sequential: Blocking 🠆 1st target primary incubation 🠆 1st target secondary incubation 🠆 Blocking 🠆 2nd target primary incubation 🠆 2nd target secondary incubation.

Each strategy bears advantages and disadvantages. The benefits of shorter processing times using simultaneous labeling must be weighed against the risks of higher background due to incomplete removal of antibodies during wash steps and increased chance of antibody cross-reactivity. Depending on the host species the primary and secondary antibodies are raised against, sequential labeling may be required to prevent secondary antibodies cross-reacting with each other, or the wrong target primary.

Choosing fluorophores

Regardless of the labeling strategy being applied, great care must be taken to ensure the spectral properties of the chosen fluorophore(s) are compatible with the laser/filter set up of the fluorescence microscope being used for imaging. For multiplex experiments using multicolor staining, selected fluorophores must also be compatible with one another to avoid spectral overlap resulting in signal bleed-through. Commonly used fluorophores and their spectral properties are illustrated in Figure 7.

Graph of common fluorophore excitation and emission wavelengths

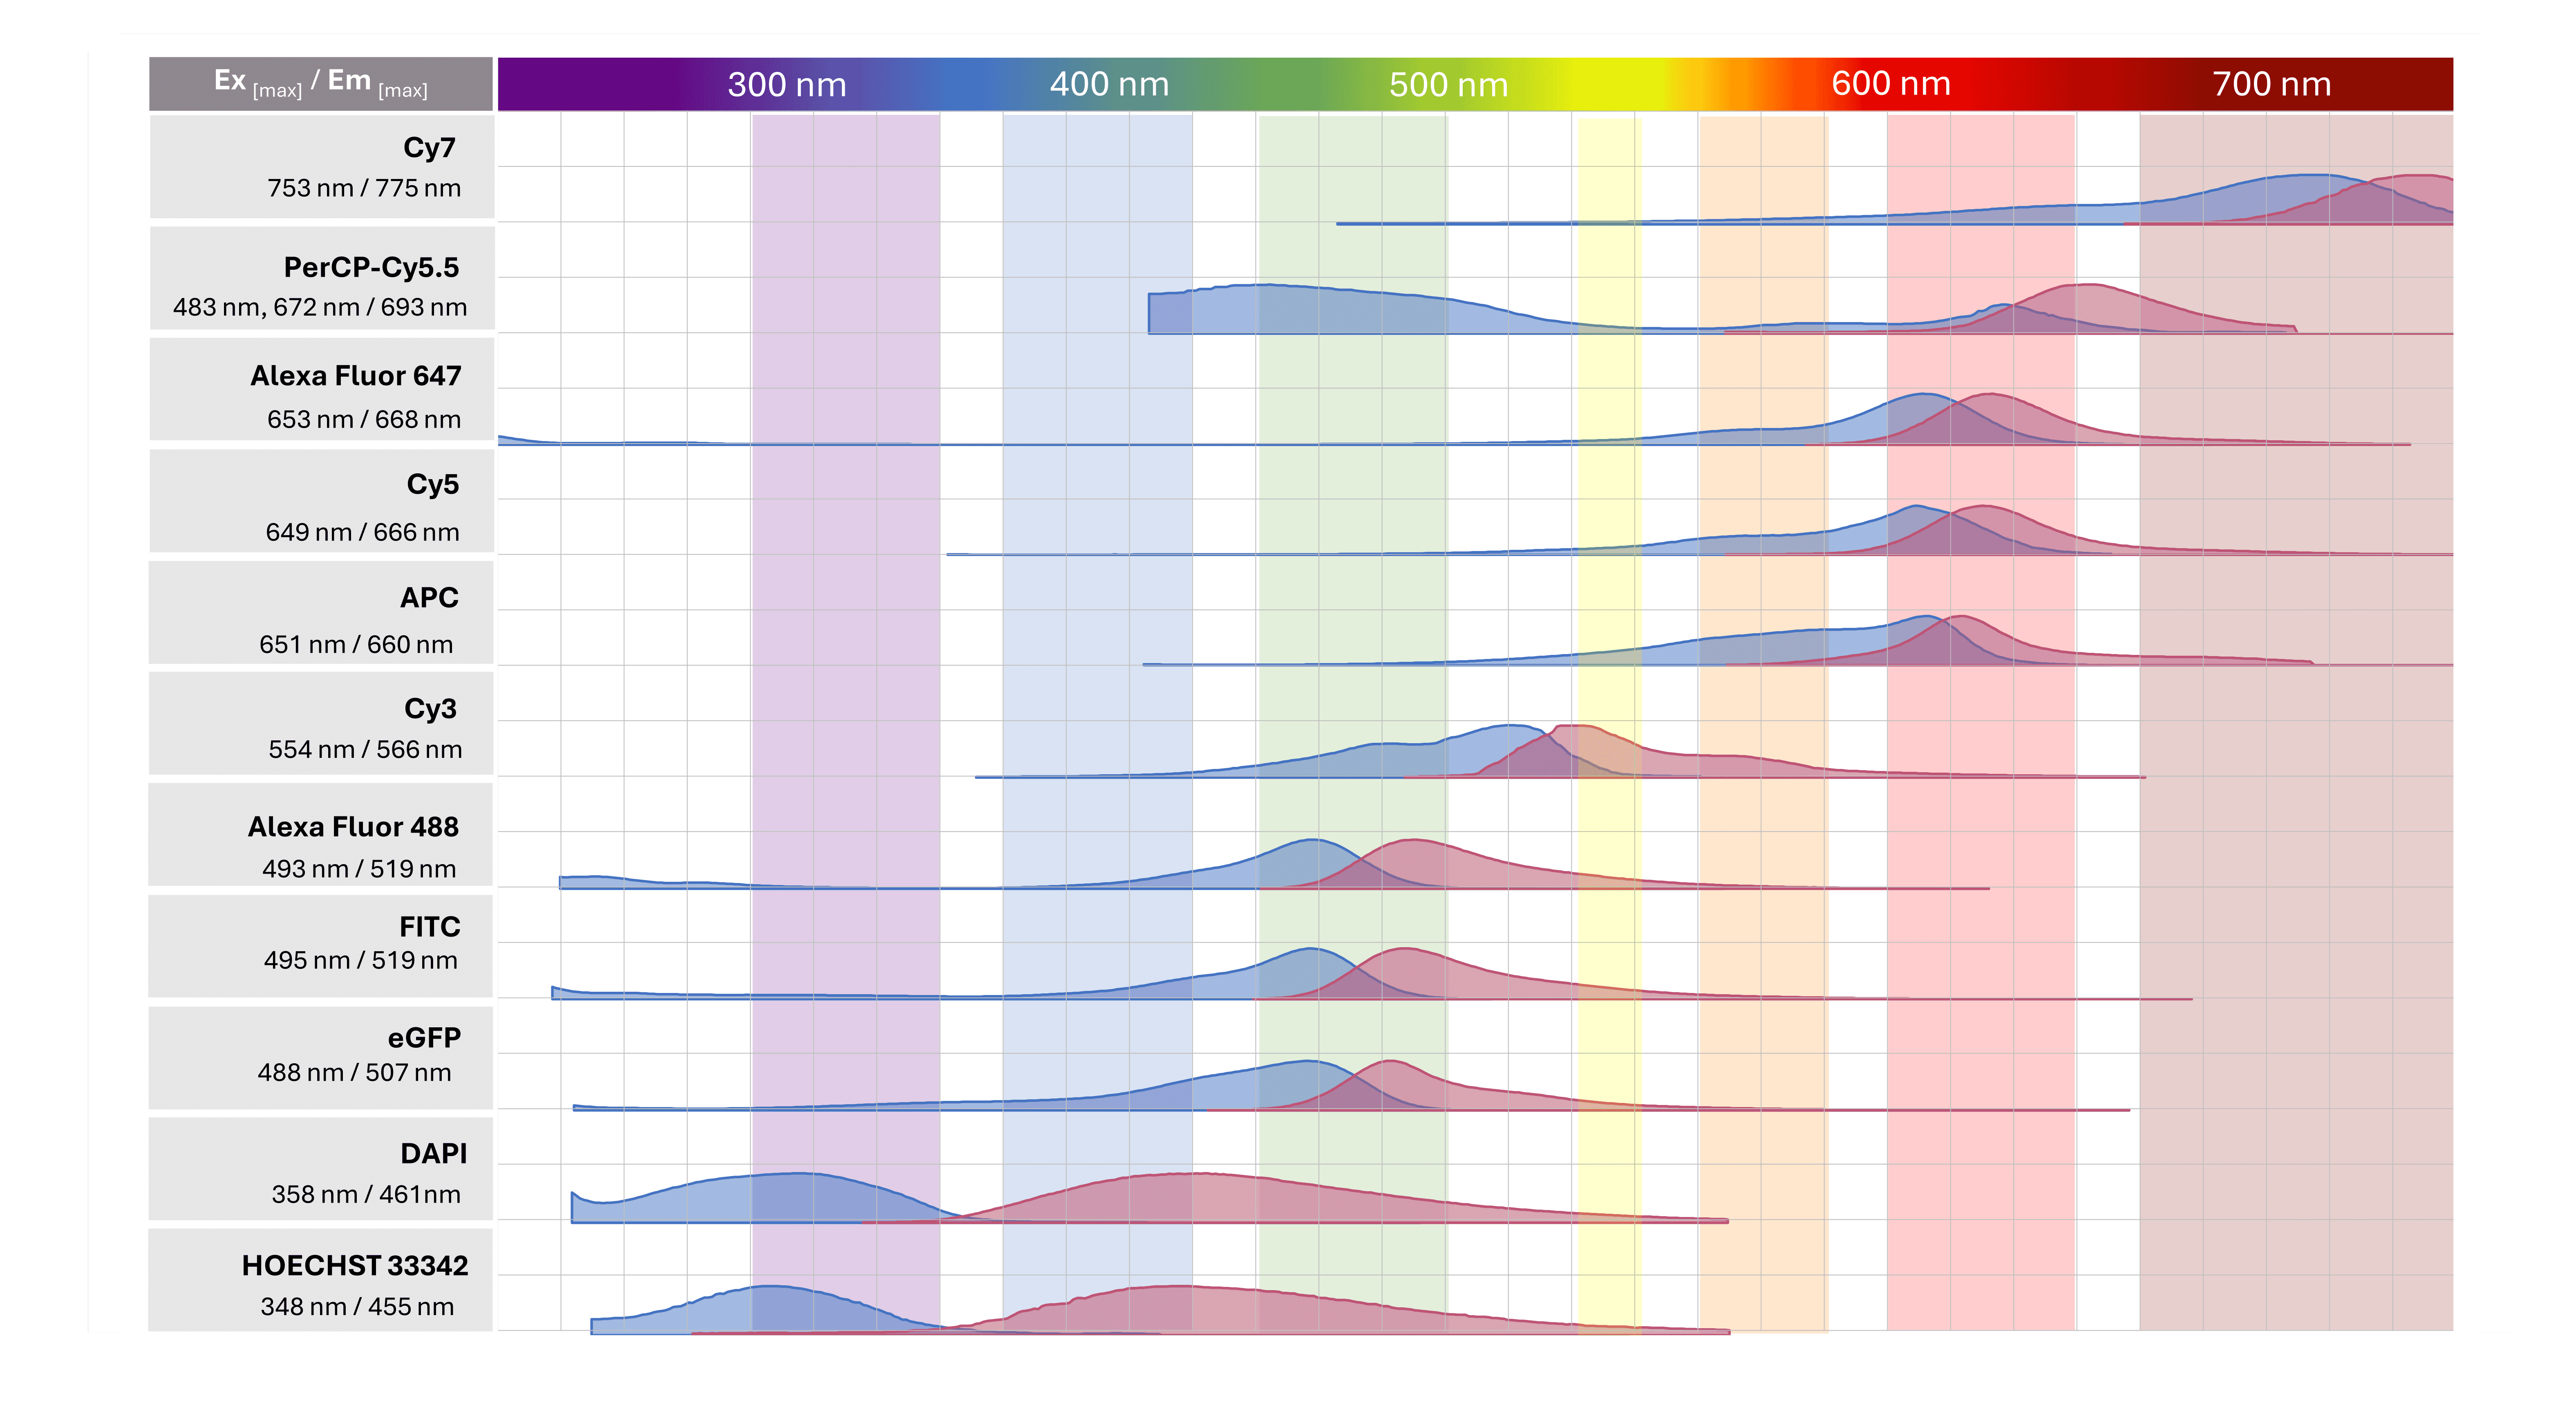
Figure 7. Commonly used fluorophores in research.

Fluorophore/Microscope compatibility

It is essential that researchers only choose fluorophores with excitation/emission spectra that are compatible with the laser and filter setup of the fluorescence microscope being used for imaging. This information can be found on the specification sheets of commercially available conjugated antibodies. Invariably, the wavelengths of light maximally absorbed during excitation and maximally emitted during fluorescence will be listed. For example, the excitation/emission maxima for TRITC fluorescent dye are 547 nm / 572 nm. While these values represent maxima, it is important to realize fluorophores still absorb and emit across a range of wavelengths, which can be visualized on freely available spectrum viewers. Depending on how broad or narrow absorption/emission profiles are, a sub-optimal laser/filter setup can still produce a dim image.

Selecting fluorophores with appropriate brightness

Intrinsic fluorophore brightness is determined by two properties, the extinction coefficient (ε) and the quantum yield (ϕ). The extinction coefficient is a measure of absorption efficiency, providing the probability that a fluorophore will absorb a photon of light at a given wavelength. The quantum yield measures emission efficiency, a ratio reporting the average number of photons emitted of a given wavelength for every photon absorbed, also of a given wavelength. These properties can be used to distinguish bright dyes from those that are dim.

It is helpful to consider the brightness of a chosen fluorophore in the context of target antigen abundance. The brightness of the detectable signal should not be excessive, thus specific and sensitive antibodies targeting abundant antigens should be conjugated to fluorophores with lower brightness. Equally, the signal produced detecting low-abundance antigens can be boosted through the use of bright fluorophores with high ε and ϕ values. Managing signal brightness is particularly useful when performing multi-color experiments. Complementing fluorophore selection against differing antigen abundance will ensure similar signal brightness between targets upon imaging. This simplifies microscope setup with even, minimal exposure times that minimize photobleaching.

Photobleaching

Photobleaching is a phenomenon which diminishes fluorophore fluorescence following prolonged exposure to excitation radiation. This can be minimized through the selection of fluorophores which are more photostable. In addition to choosing fluorophores with high photostability, photobleaching can be controlled by limiting the intensity and duration of excitation by decreasing laser power and reducing exposure times respectively. Use of mounting media with anti-fade reagents also minimizes photobleaching effects in samples.

Spectral overlap (bleed-through)

Each fluorophore emits radiation across a range of wavelengths; this constitutes its emission spectral profile. During multi-color experiments, it is important that combinations of fluorophores are used which are as isolated as possible (Figure 8). This means that spectral overlap is minimized, ensuring the detected signal through one filter has not been emitted by the fluorophore belonging to a neighboring filter set. When designing experiments pay close attention to the spectral properties of fluorescent probes and dyes being used; this includes the emission profiles of nuclear stains, for example, DAPI. In addition to careful fluorophore choice, emission filter thresholds on microscopes can also help to mitigate bleed-through.

Graphs of fluorophore emission or excitation spectra illustrating the concept of bleedthrough

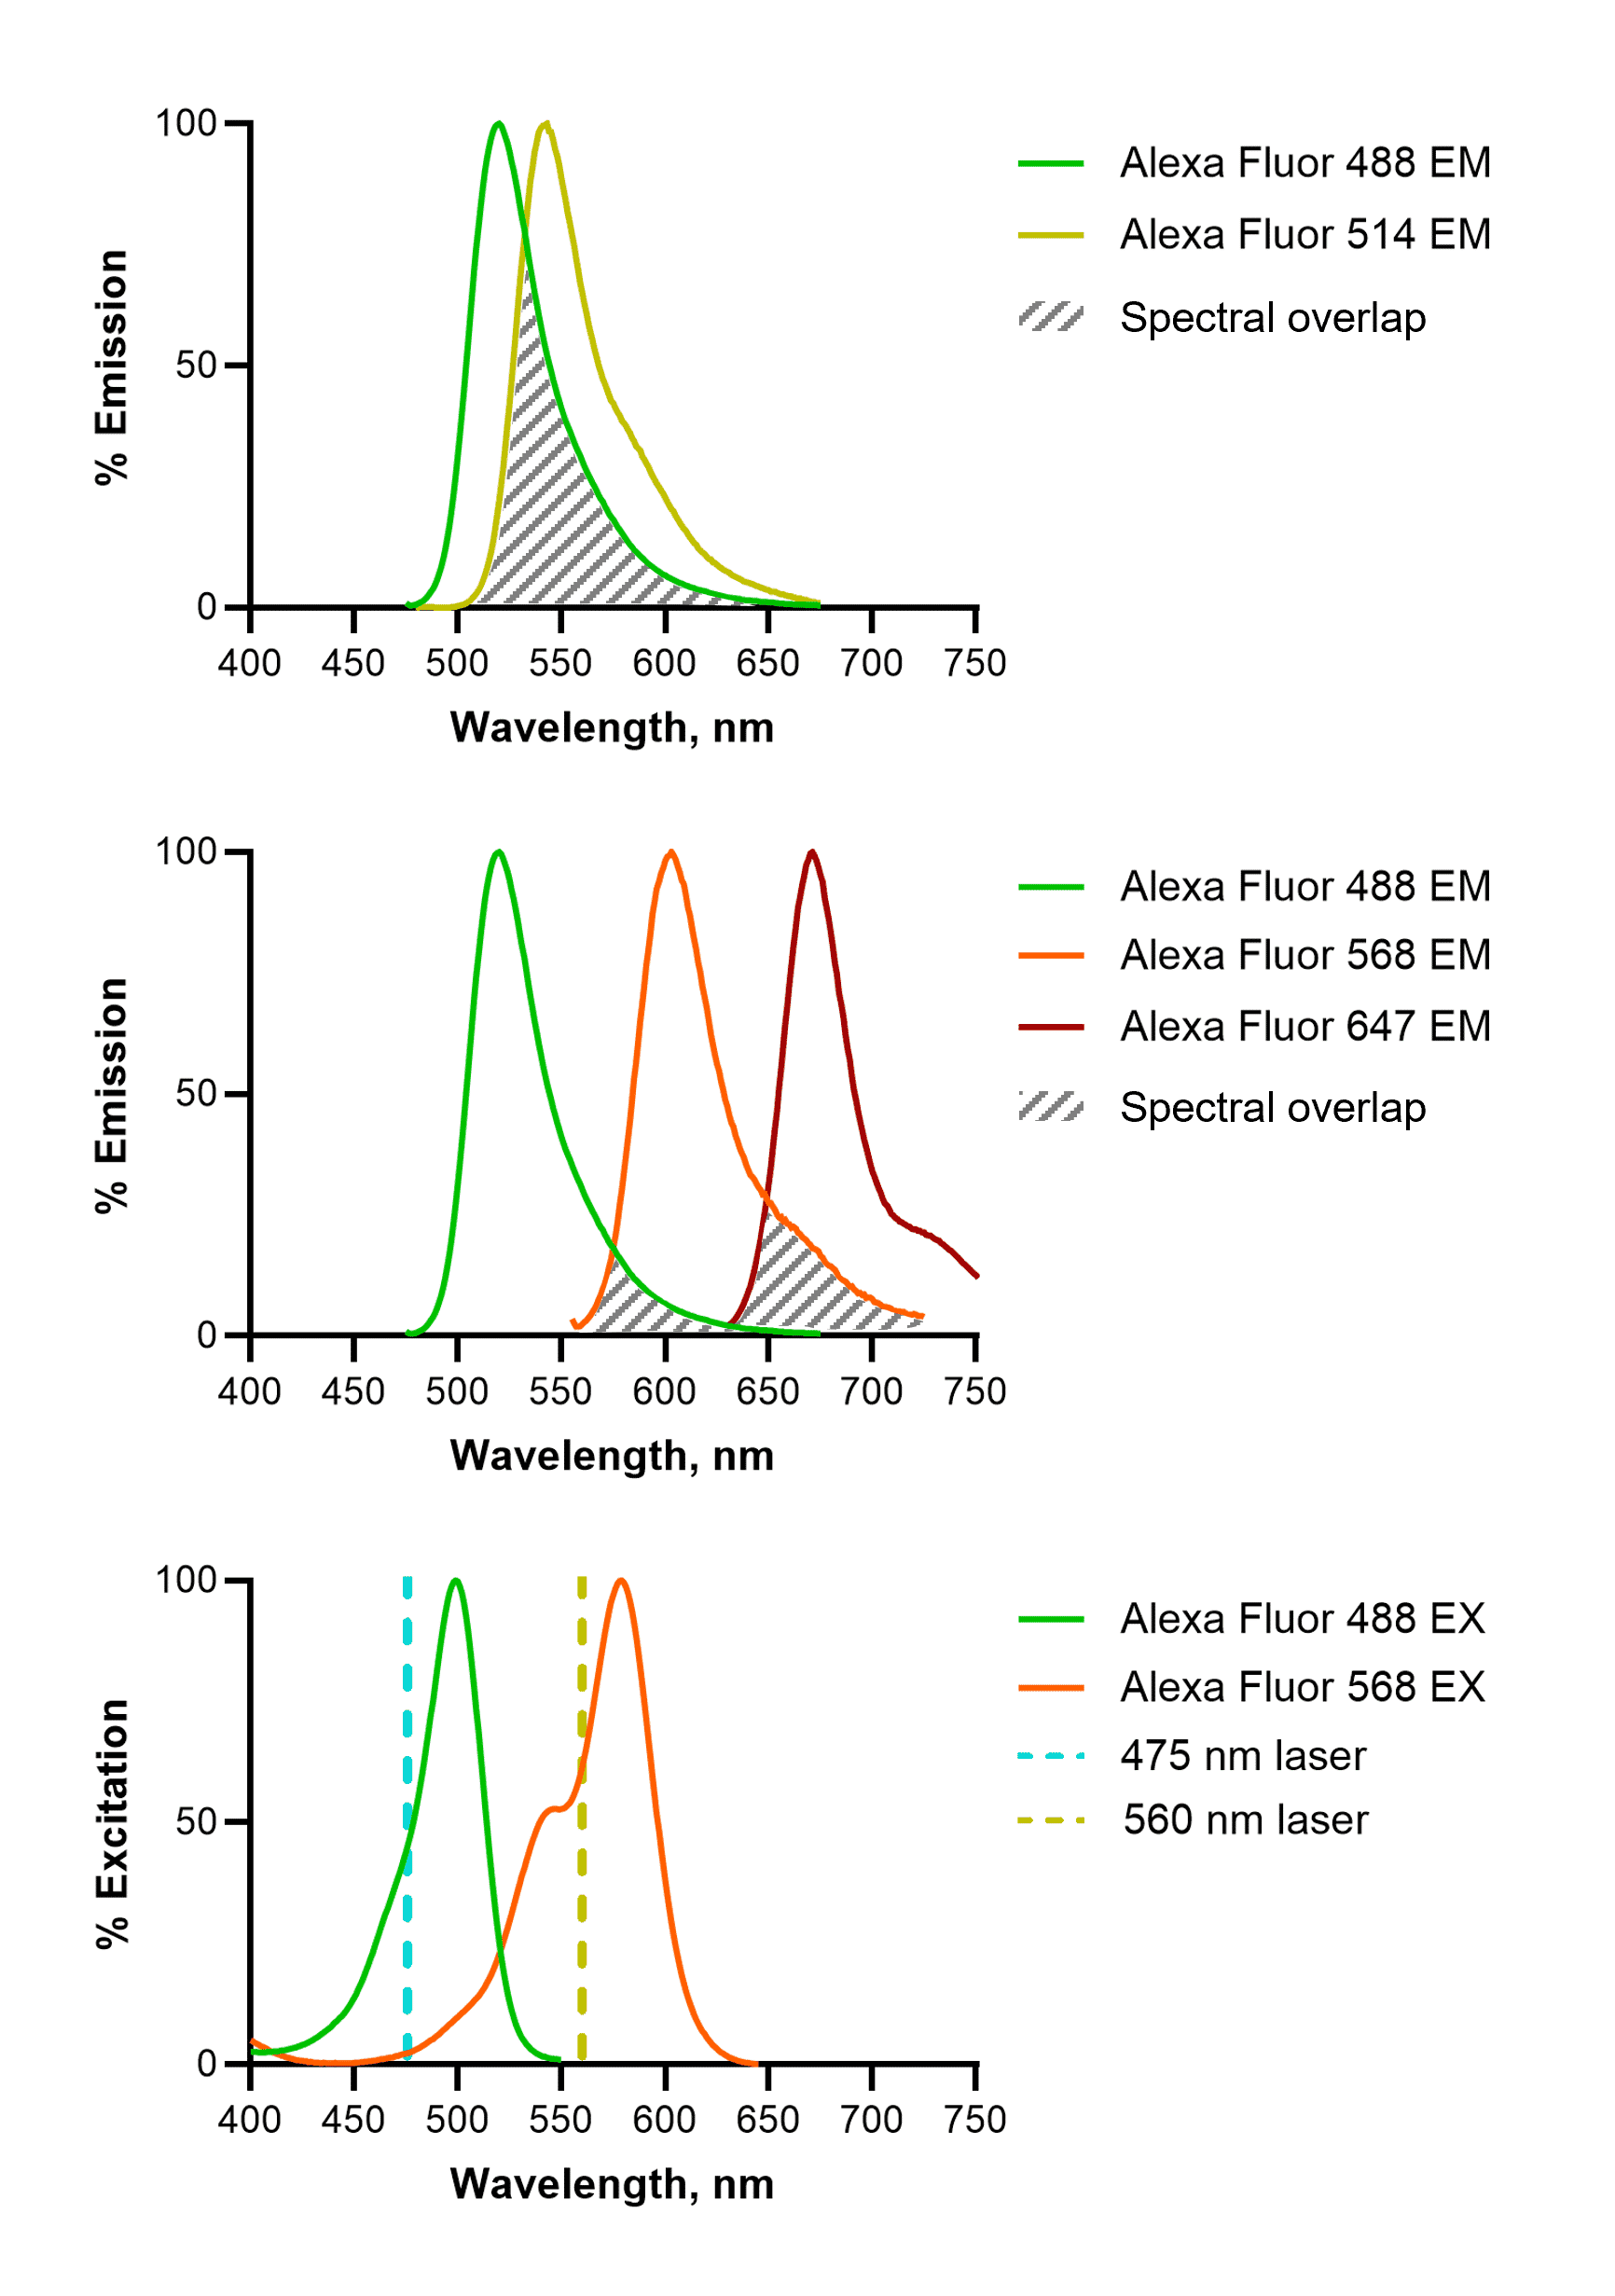
Figure 8: Spectral overlap in fluorescence imaging. Fluorophores that emit in similar spectral ranges, such as Alexa Fluor (AF)488 and AF514 are difficult or impossible to distinguish (top). This can be mitigated by choosing well-spaced fluorophores (middle), and by choosing fluorophores that are activated by distinct lasers (bottom). For example, AF568 shows almost no excitation by a 475 nm laser, which is required to excite AF488. EM: emission; EX: excitation.

Counterstaining and mounting

Following detection of the target antigens by immunolabeling samples can be counterstained in order to define individual cells and cell structures. The most common fluorescent dyes delineate nuclei by binding DNA, such as DAPI (0.1 μg / ml) or Hoechst 33342 (0.1 – 1 μg / ml). Nuclear counterstains are typically incubated with samples at room temperature for 5 - 15 minutes, or may even be incorporated into the mounting medium.

Non-nuclear regions can also be identified, such as by using phalloidin (200 units/ml or 6.6 μM), an F-actin-binding fluorescent dye that highlights the cytoplasm. Such staining often takes place at the same time as primary antibody incubations.

Like fluorophores conjugated to the secondary antibodies, counterstains have inherent spectral properties that must not overlap with other fluorophores being used. For example, DAPI emits strongly in the blue region of the spectrum, thus should not be used alongside blue dyes such as Alexa Fluor 405.

Table 3 below lists some common fluorescent dyes for use in ICC-IF. A number of fluorescent dyes for other organelles, such as mitochondria and Golgi, are also available commercially for both live and fixed cell imaging.

Name Target Color
DAPI Nucleic acids Blue
Hoechst 33342 Nucleic acids Blue
Hoechst S769121 Nucleic acids Yellow
DRAQ5 Nucleic acids Far red
DRAQ7 Nucleic acids Far red
Phalloidin Actin filaments Conjugated to various fluorophores
Wheat germ agglutinin (WGA) Plasma membrane Conjugated to various fluorophores

Table 3:Commonly used fluorescent counterstains and their target organelle.

After counterstaining, coverslips are ready to be mounted on to glass slides for storage and imaging. A drop of mounting medium is added to each slide before the coverslips are gently lowered onto the slide with the cells facing down. Care should be taken to avoid the formation of air bubbles between the slide and coverslip. Depending on the mounting medium being used, the perimeter of the coverslips may need to be sealed using clear nail varnish. This is not required for hard-setting media, which should instead be left to dry and polymerize fully, sometimes for as long as 24 hours. For improved detection sensitivity with dyes which have low photostability and rapidly bleach, anti-fade mounting media products should be preferred. Samples can be stored in the dark at 4°C for several months before imaging depending on the stability of the fluorophores.

Sample visualization

Once prepared, samples can be visualized by fluorescence microscopy. Excitation radiation is emitted by a light source before passing through an excitation filter. Possible light sources include mercury-vapor lamp, LEDs, and lasers. Filtered excitation radiation is reflected on to the sample by a dichroic mirror where it is absorbed by fluorophores. Emitted radiation is transmitted through the dichroic mirror before passing through an emission filter. Fluorescence signal is viewed through the eye-piece or detected by a monochrome camera. Confocal microscopy utilizes ‘optical sectioning’ to improve the spatial resolution of the fluorescence image, using a pinhole to exclude light from outside the focal plane. Other setups allow for rapid, quantitative single-cell analyses to be performed through high-content screening of multiple samples.

References

Diagrams created with BioRender.com.

  1. Wu, Y., Li, Q. & Chen, X.-Z. Detecting protein–protein interactions by far western blotting. Nat. Protoc. 2, 3278–3284 (2007).
  2. Arkin, M. R., Glicksman, M. A., Fu, H., Havel, J. J. & Du, Y. Inhibition of Protein-Protein Interactions: Non-Cellular Assay Formats. in Assay Guidance Manual (2012).
  3. Behring, E. A. von & Kitasato, S. Ueber das Zustandekommen der Diphtherie-Immunität und der Tetanus-Immunität bei Thieren. Dtsch. Med. Wochenschr. 16, 1113–1114 (1890).
  4. Behring, E. A. von. Untersuchungen über das Zustandekommen der Diphtherie-Immunität bei Thieren. DMW - Dtsch. Med. Wochenschr. 16, 1145–1148 (1890).
  5. Holyoak, T. Molecular Recognition: Lock-and-Key, Induced Fit, and Conformational Selection. in Encyclopedia of Biophysics, 1584–1588 (2013). doi:10.1007/978-3-642-16712-6_468.
  6. The Nobel Prize in Physiology or Medicine 1908. NobelPrize.org.
  7. Acuña, A. U. & Amat-Guerri, F. Early History of Solution Fluorescence: The Lignum nephriticum of Nicolás Monardes. in Fluorescence of Supermolecules, Polymers, and Nanosystems 3–20 (2008).
  8. Stokes, G. G. XXX. On the change of refrangibility of light. Philos. Trans. R. Soc. Lond. 142, 463–562 (1852).
  9. Baeyer, A. Ueber eine neue Klasse von Farbstoffen. Berichte Dtsch. Chem. Ges. 4, 555–558 (1871).
  10. Coons, A. H., Creech, H. J. & Jones, R. N. Immunological Properties of an Antibody Containing a Fluorescent Group. Proc. Soc. Exp. Biol. Med. 47, 200–202 (1941).
  11. Riggs, J. L., Seiwald, R. J., Burckhalter, J. H., Downs, C. M. & Metcalf, T. G. Isothiocyanate Compounds as Fluorescent Labeling Agents for Immune Serum. Am. J. Pathol. 34, 1081–1097 (1958).
  12. Southwick, P. L. et al. Cyanine dye labeling reagents—carboxymethylindocyanine succinimidyl esters. Cytometry 11, 418–430 (1990).
  13. Renz, M. Fluorescence microscopy—A historical and technical perspective. Cytometry A 83, 767–779 (2013).
  14. Ploem, J. S. The use of a vertical illuminator with interchangeable dichroic mirrors for fluorescence microscopy with incidental light. Z. Wiss. Mikrosk. Mikrosk. Tech. 68, 129–142 (1967).
  15. Leavy, O. The birth of monoclonal antibodies. Nat. Immunol. 17, S13–S13 (2016).
  16. Griffiths, G. Introduction to Immunocytochemistry and Historical Background. in Fine Structure Immunocytochemistry, 1–8 (1993).
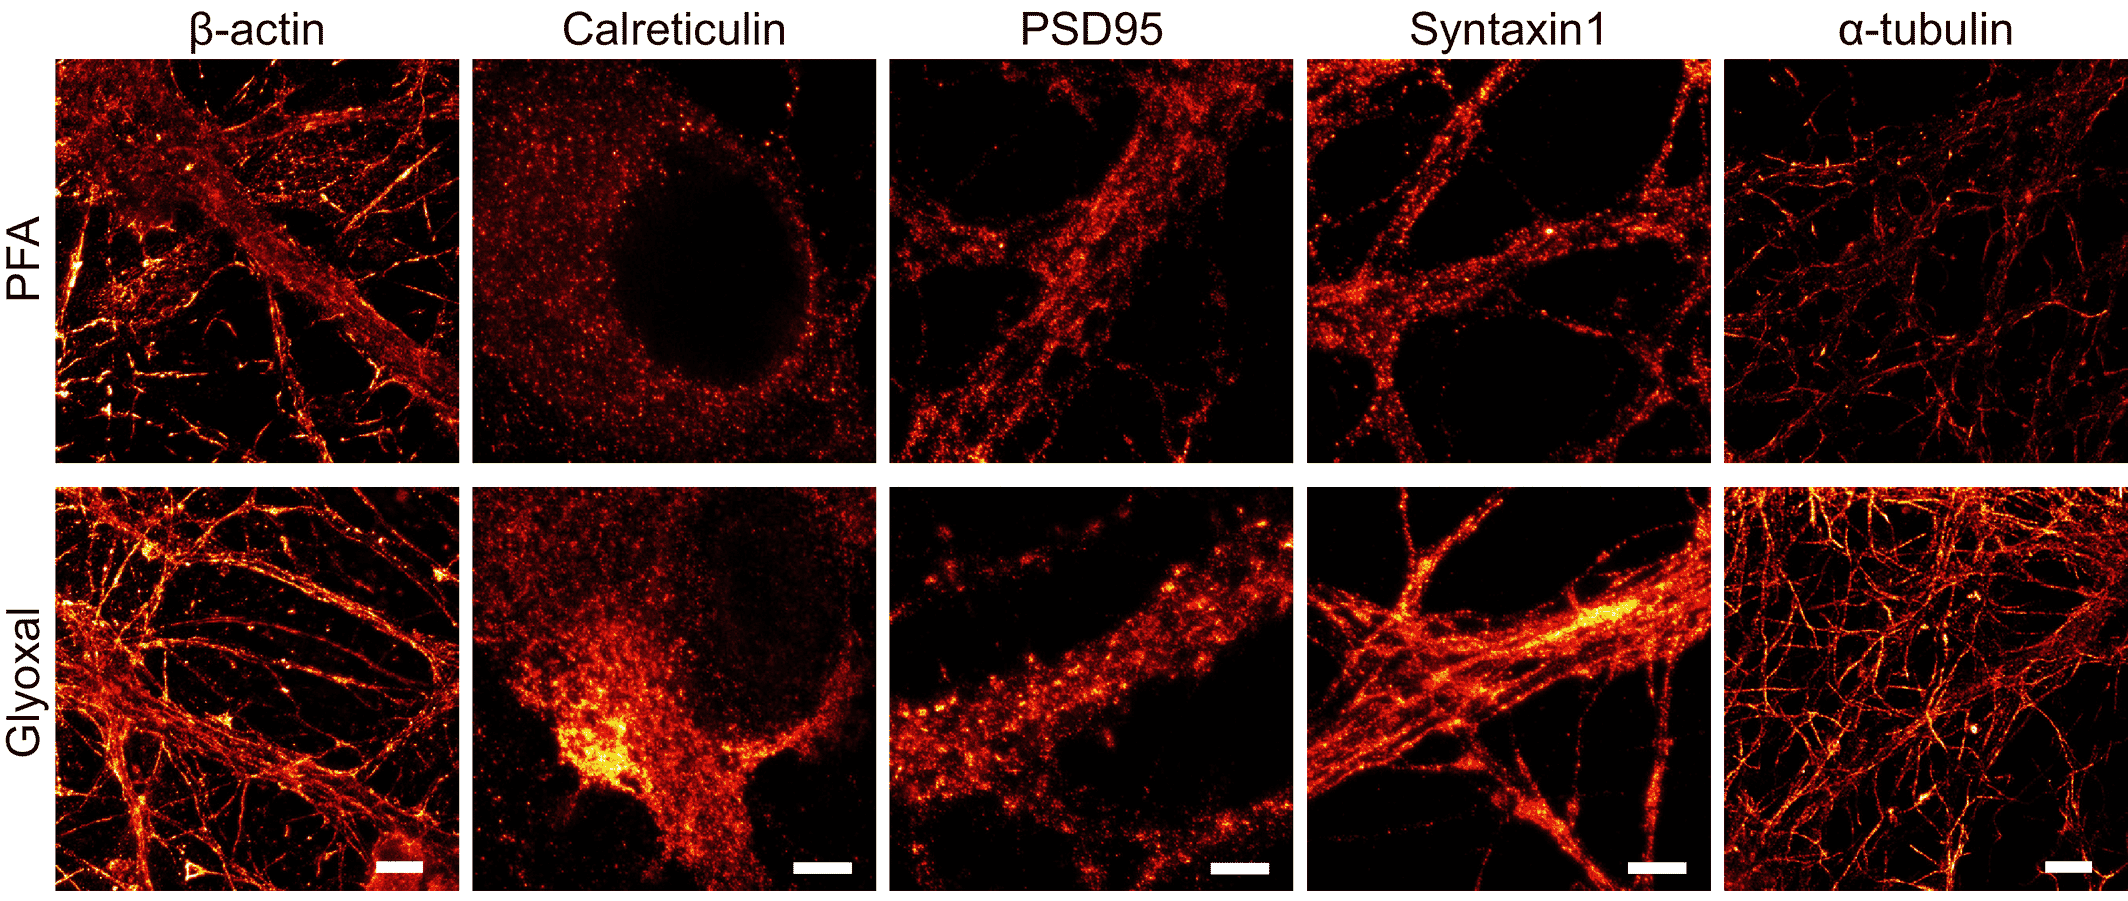
  17. Richter, K. N. et al. Glyoxal as an alternative fixative to formaldehyde in immunostaining and super‐resolution microscopy. EMBO J. 37, 139–159 (2018).
  18. Konno, K., Yamasaki, M., Miyazaki, T. & Watanabe, M. Glyoxal fixation: An approach to solve immunohistochemical problem in neuroscience research. Sci. Adv. 9, eadf7084 (2023).
Side Menu Main Menu Contact Us 0Checkout
Top