Ryan Hamnett, PhD | 6th April 2024
The enzyme-linked immunosorbent assay (ELISA) is a technique that uses antibodies to specifically detect and quantify the amount of a target antigen in a liquid sample. ELISAs are distinct from other antibody-based methods in that the antibody-epitope interaction occurs with one component immobilized to a solid surface, typically a multi-well polystyrene plate, which makes it easier to wash away any non-specifically bound material. Enzyme- or fluorescence-conjugated antibodies then enable detection, with the amount of color, chemiluminescence or fluorescence directly corresponding to the amount of antigen in the sample.
ELISAs are high throughput, quantitative, highly specific, and can be adapted to measure the levels of analytes from a variety of sample types, making them now commonplace in research and diagnostic applications.
This guide aims to provide an overview of ELISA formats, experimental design, important controls, protocols, and troubleshooting. The critical technical aspects of ELISA will be discussed, providing an approach that can then be tailored to your specific research objectives.
ELISA is an ideal technique to choose when experimental aims revolve around quantification of a target protein in a complex mixture. In addition to qualitative indications of presence or absence of an analyte in a sample, ELISAs can provide a measurement of absolute levels of protein or peptide in a large number of samples, giving it a strong advantage over related techniques such as immunohistochemistry (IHC), immunocytochemistry (ICC), or western blot. Applications for these techniques and some key differences between them are summarized in Table 1.
| ELISA | ICC/IHC | Western Blot | |
|---|---|---|---|
| Sample Preparation | Lysed cells or tissueBiological fluids (plasma, urine, cell culture supernatant) | Fixed cells on coverslip (ICC)Fixed tissue sectioned or wholemount (IHC) | Lysed cellsDenatured protein |
| Protein State | Native, unfixed | In situ, but fixed | Denatured |
| Multiplex | No, typically requires bead-based immunoassays for multiplexing | Easily up to 4 targets; more are possible through unmixing or sequential probing | Fluorescent multiplexing is possible, as is sequential blotting (stripping and re-blotting the same membrane |
| Quantitative | Yes | Semi | Usually semi |
| Can be high throughput? | Commonly | Yes | Rarely |
| Sensitivity* ability to detect low levels of target | High | Medium | High |
| Specificity* antibody binding only the target protein | High, particularly sandwich ELISAs | Medium | High |
| Subcellular compartmentalization of proteins | Limited to subcellular fractionation | Highly suitable | Limited to subcellular fractionation |
| Expression in mixed cell populations | Limited to cell sorting before application | Highly suitable | Limited to cell sorting before application |
| Protein-protein interactions | Yes1 | Limited to co-localization in cells or subcellular compartments | Yes, through far-western blotting2 |
| Protein weight or size | None | None | Highly suitable |
Table 1: Key applications and differences between common biochemical techniques for protein detection.
The development of the ELISA has its roots in the radioimmunoassay (RIA), first described in 1960 by Rosalyn Sussman Yalow and Solomon Berson to quantify levels of plasma insulin in humans using radiolabeled antibodies.3 Despite the importance of the technique, with Yalow later receiving the Nobel Prize in Physiology or Medicine alongside Roger Guillemin and Andrew Schally for the development of the RIA, the radiation required by the technique posed significant health concerns. Seeking a less hazardous alternative to radioactive labels, Peter Perlmann and Eva Engvall in 1971 developed a non-radioactive version of the assay: the ELISA.4 The key innovation was to replace the radioactive label with an enzyme, alkaline phosphatase (AP), an approach that had been pioneered in immunohistochemistry to detect antigens in tissue but had not yet been applied to quantitative antigen detection. AP catalyzed the conversion of p-nitrophenyl phosphate (NPP) to para-nitrophenol, a yellow product that could be quantified by measuring its absorbance at 400 nm (now usually 405 nm). In the same year, two other researchers took a similar approach to measure levels of human chorionic gonadotrophin with horseradish peroxidase (HRP)5.
Since then, the ELISA format has expanded to the competitive ELISA,6 sandwich ELISA,7 and indirect ELISA,8 discussed further below, as well as incorporating chemiluminescence and fluorescence for enhanced sensitivity and multiplexing capabilities.9 Shortly after their development, early adopters used ELISAs to detect malaria,10 influenza,11 and mumps,12 while in 1985, ELISA use was approved for the diagnosis of human immunodeficiency virus (HIV).13 In addition to being used to detect foreign antigens in patients, ELISAs were applied to foundational immunology research to quantify antibodies and antigens, and to pharmaceutical development, where they are used to monitor the production of biologics, including monoclonal antibodies and vaccines.
Since the 1990s, technological advancements have continued to enhance the utility, flexibility, sensitivity, and efficiency of ELISAs:
ELISAs are now commonplace and invaluable in medical diagnostics, drug development, environmental monitoring, and fundamental research.
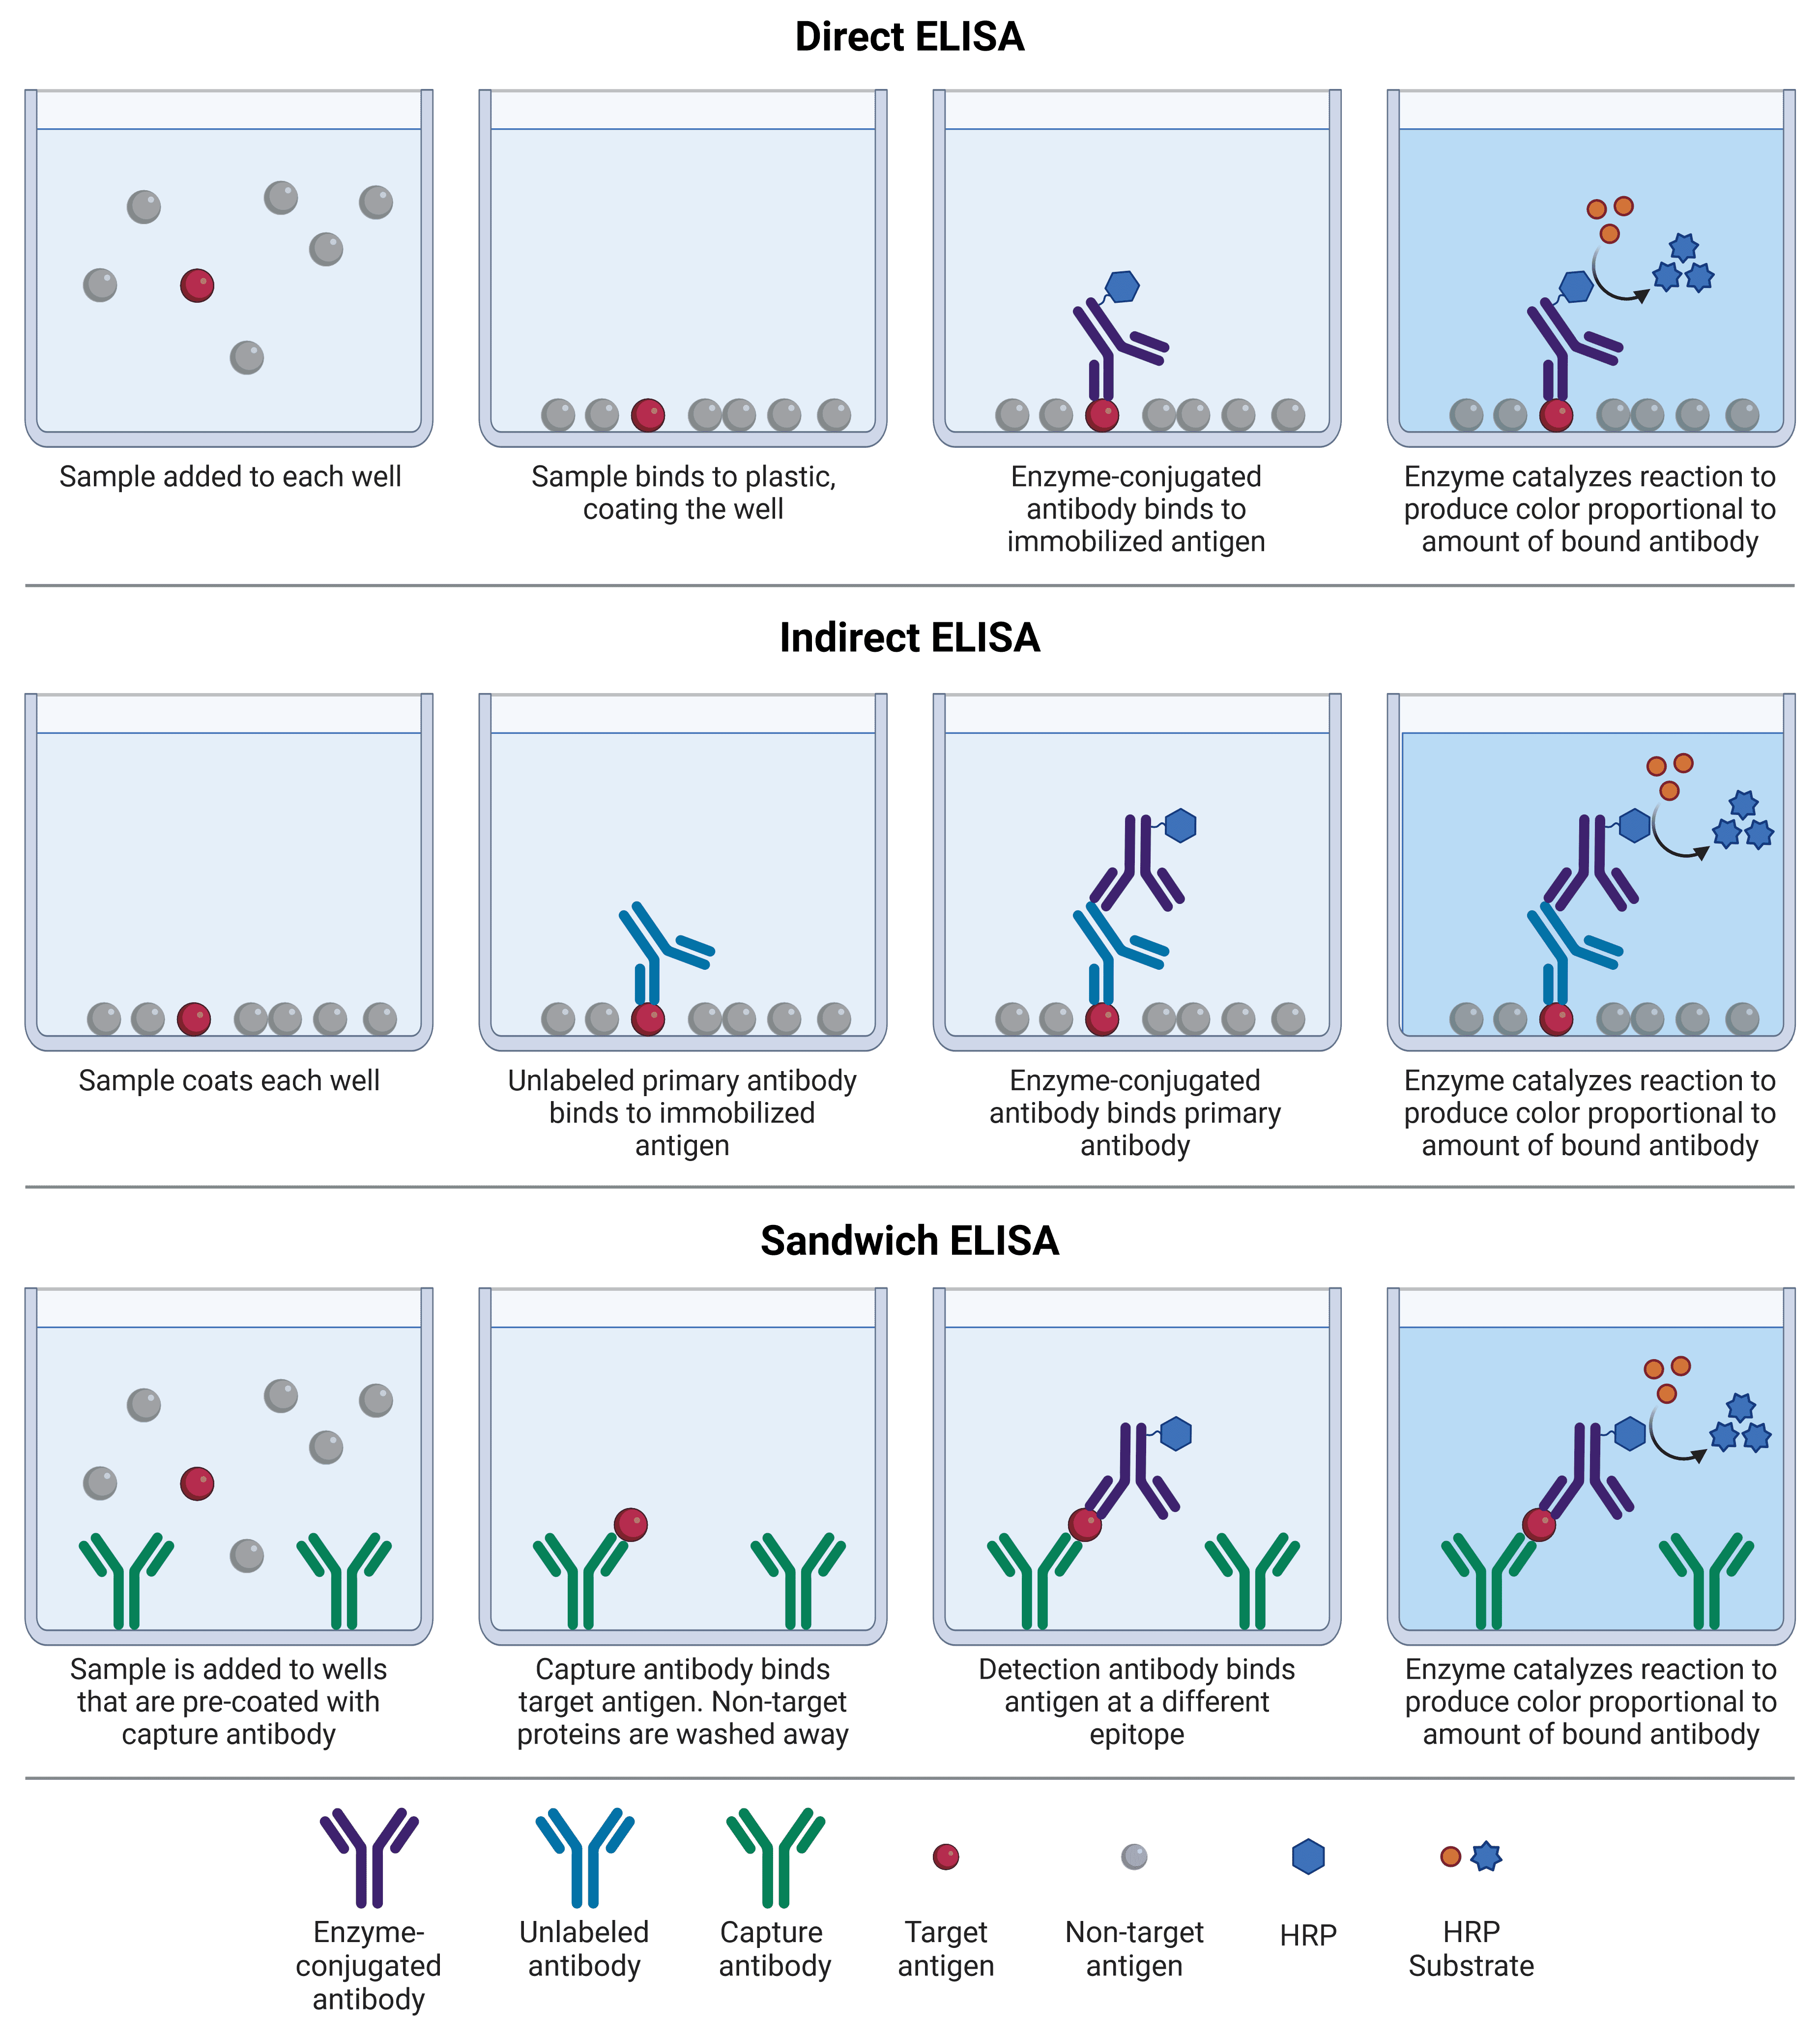
Direct, indirect, and sandwich ELISAs differ based on which protein (antigen or capture antibody) is initially immobilized to the multi-well plate, and how detection occurs (Figure 1; Table 2). Competitive ELISAs work on a slightly different principle, and can be adaptations of any of the other 3 formats. In all formats, blocking and washing steps are essential to reduce non-specific binding (e.g. of the detection antibody to the plate), and remove unbound protein, respectively.
Direct ELISAs were the first ELISAs to be developed, and are conceptually the simplest. A sample containing an antigen of interest, which has usually been purified or enriched from a cruder sample, is immobilized to a multi-well plate that binds to protein with high affinity. The target antigen is detected by an antibody directly conjugated to an enzyme, such as HRP.
Indirect ELISAs work on the same principle as direct ELISAs, but detection is a two-step process. First, an unlabeled primary antibody binds specifically to the target antigen. Second, an enzyme-conjugated secondary antibody is added that will bind to the primary antibody, based on the primary’s host species. An alternative approach to indirect ELISAs is to use a biotinylated primary antibody, which is then detected by an enzyme-conjugated avidin or streptavidin molecule; read more about avidin-biotin amplification systems below.
Indirect ELISAs benefit from greater sensitivity than direct ELISAs because more than one secondary antibody can bind to a single primary antibody, resulting in more opportunities for producing the colored product. It also provides greater flexibility, as labeled primary antibodies may not be commercially available, whereas labeled secondary antibodies need only be directed against a host species (e.g. rabbit). Indirect ELISAs can be useful for measuring the amount of a specific antibody present in a sample, which binds to a control antigen immobilized on the plate and is recognized by a secondary antibody specific to a given isotype.
Sandwich ELISAs are so named because the target antigen acts as the ‘filling’ in between two antibodies. A specific, unlabeled antibody termed the capture antibody is immobilized on a plate instead of the sample. When the sample is added, only the target antigen will bind to the capture antibody, while the rest of the sample is washed away. A second, matched antibody termed the detection antibody is then added, which binds the same antigen as the capture antibody but recognizing a different epitope. This detection antibody can be enzyme-conjugated (direct sandwich ELISA), or a third antibody raised against the host species of the detection antibody can be added (indirect sandwich ELISA).
The matched pairing of antibodies in sandwich ELISAs makes them far more specific than conventional direct or indirect ELISAs, though finding an antibody pair requires optimization if a standardized or commercial option is not available, because the antibodies must not interfere with each other’s binding. For this reason, monoclonal antibodies tend to be used. They also exhibit less non-specific binding, because off-target proteins in the sample are not given the opportunity to bind to the plate before being washed away.
Figure 1: Schematic comparison of different ELISA formats. Each of these can also be used with alkaline phosphatase (AP), and amplification methods such as biotin-avidin.
| Direct | Indirect | Sandwich | |
|---|---|---|---|
| Sample | Should be purified or enriched for antigen, because all proteins in the sample will bind to plate | Should be purified or enriched for antigen, unless using to measure antibody levels | Can be impure/crude mix |
| Flexibility | Enzyme-conjugated primary antibodies are less common, so this is less flexible than indirect methods | High – one labeled secondary antibody can be used in experiments targeting different primary antibodies | Both direct and indirect detection are possible |
| Specificity | Likely to have more non-specific binding unless sample is highly pure | Similar to direct ELISA | Highest, because two antibodies are required |
| Sensitivity | Least sensitive approach | Higher – more than one labeled secondary antibody can bind to primary, resulting in amplification | Highest |
| Speed | Fast, as few steps | Extra incubation and wash steps due to secondary antibody | Slowest, particularly if doing an indirect ELISA, which requires 3 different antibodies |
| Applications | Analyzing immune responses to antigens | Determining antibody concentration in samples | Complex samples, low abundance antigens |
| Cross-reactivity | None | Higher | Highest chance, particularly if doing an indirect sandwich – capture and detection antibodies would need to be from different hosts |
Table 2:Comparison of main features of different ELISA formats.
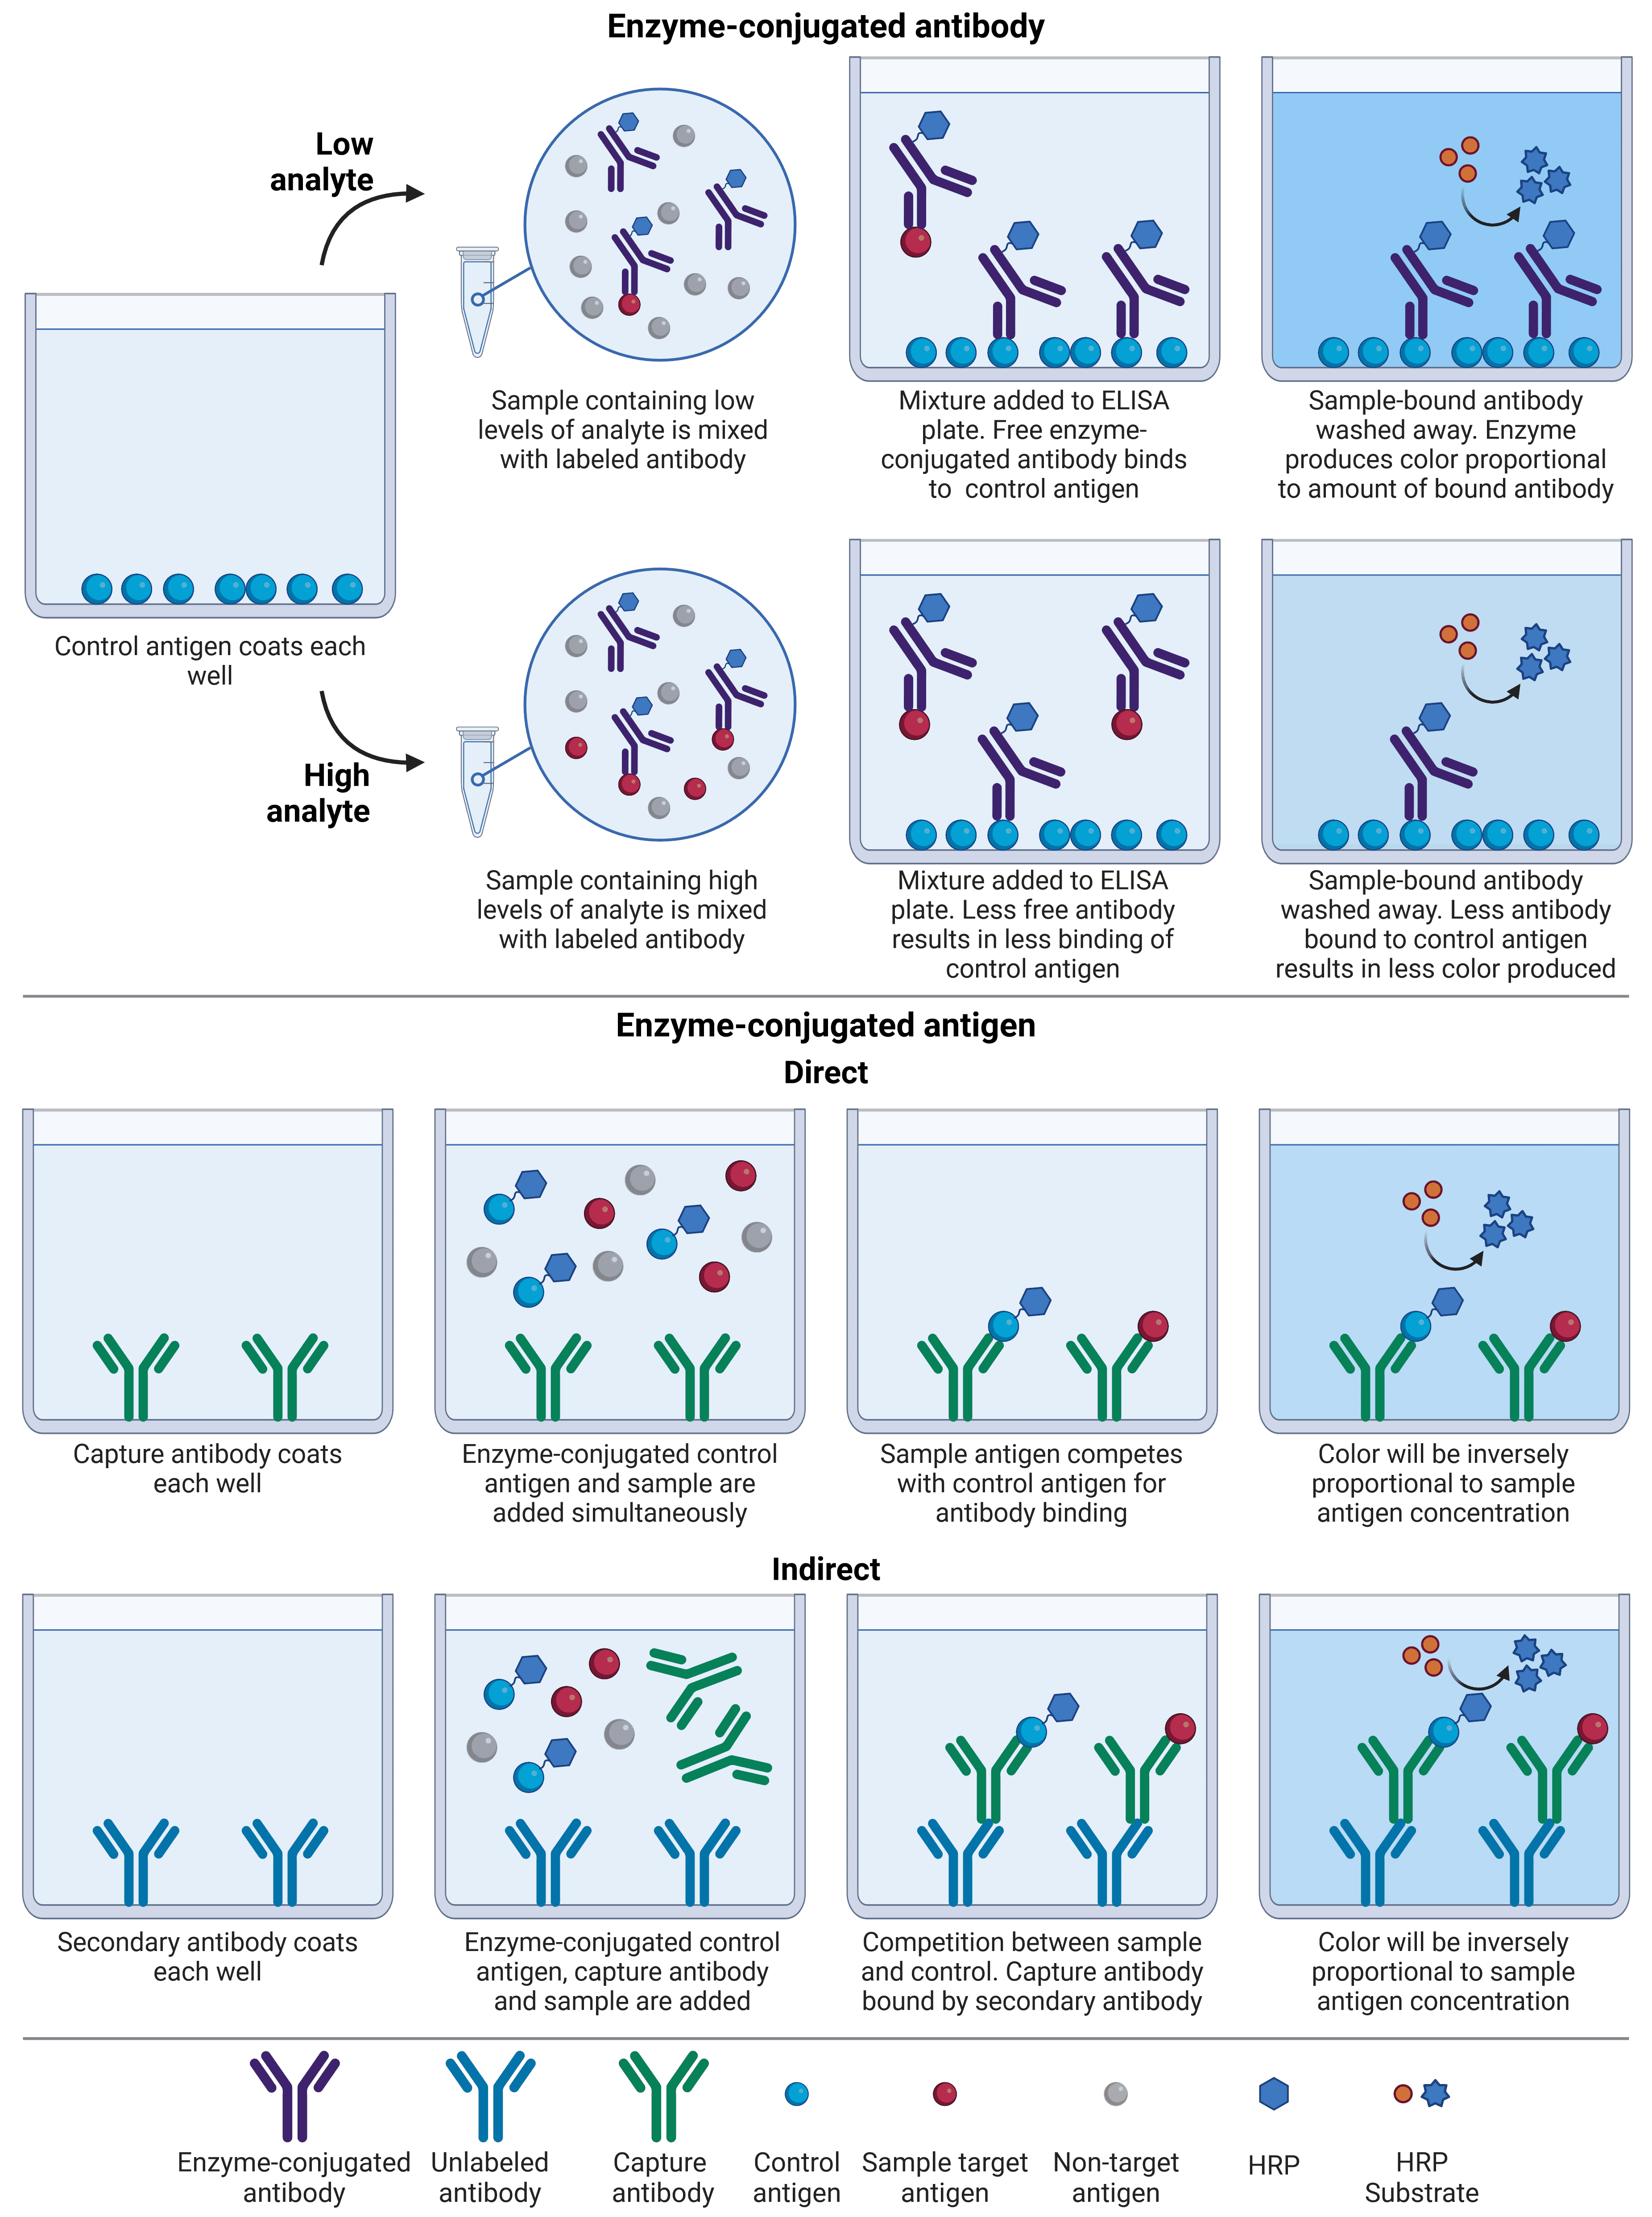
Also known as an inhibition ELISA, the competitive ELISA is the most complex format. Unlike a conventional ELISA, competitive ELISAs work by measuring interference of a strong signal: the more target antigen in the sample, the lower the output signal, because sample antigen competes with a control antigen for antibody binding (Figure 2).
There are several different formats of competitive ELISA, and they can be adaptations of any of the three ELISA formats described above. In one common format, instead of being immobilized to a plate, the sample is mixed with a labeled antibody. The antigen-antibody mix is then added to a multi-well plate that has been pre-coated with a purified control antigen, which has the same antigen identity but is not from an experimental sample. Any antibody that is not already bound to the sample antigen will instead bind to the control and will remain for detection, while sample antigen-antibody complexes will be washed away. Hence, a high analyte concentration will result in little available antibody to bind to control antigen, and therefore low signal.
Another format involves enzyme-conjugated control antigen, rather than enzyme-conjugated antibody. In this format, the plate is coated with an antibody, which is either a capture antibody specific to analyte (direct) or an antibody that will recognize immunoglobulins from a particular species (indirect), e.g. goat anti-rabbit. For direct detection, test sample and enzyme-conjugated control antigen are added simultaneously, and a stronger signal will indicate that more control antigen is bound, reflecting lower analyte concentration in the sample. For indirect detection, test sample, enzyme-conjugated control antigen and capture antibody are added simultaneously. The control antigen and sample antigen will compete for binding to the capture antibody, which in turn is bound by the secondary antibody bound to the plate.
Competitive ELISAs are commonly used if there are not matched pairs of antibodies available for a given antigen, such as if they are too small to be bound by two separate antibodies. They are also do not require much sample processing, meaning cruder preparations can be used. However, the antigen of interest should display only one epitope that will be recognized by the antibody for results to be accurate, making monoclonal antibodies preferable for this format.
Figure 2: Comparison between different competitive ELISA formats. Competitive ELISAs can either have antibody or control antigen labeled with enzyme. Less color is produced in the presence of a large amount of analyte, regardless of format.
A common adaptation to indirect and sandwich ELISAs is to enhance signal intensity, and therefore assay sensitivity, using avidin-biotin systems of amplification. Biotin is a small molecule that can easily be covalently bonded to proteins. Avidin is a protein found in egg whites, while streptavidin is purified from the bacterium Streptomyces avidinii, but they both have an extremely high and specific affinity for biotin. To increase ELISA signal with the biotin-avidin system, biotinylated detection antibodies are bound either by enzyme-conjugated avidin, or by a pre-incubated mixture of avidin and biotinylated enzyme, with the latter termed “avidin-biotin complex” (ABC) signal amplification.
Signal amplification is achieved because biotinylation (labeling an antibody with biotin) usually leads to multiple biotin molecules being attached to each detection antibody, resulting in multiple opportunities for avidin binding, and therefore for enzyme-mediated catalysis of the substrate. Further, ABC amplification is so effective because avidin molecules have four binding sites for biotin, meaning that many avidin-biotin-enzyme complexes cluster at a single detection antibody.
The majority of ELISAs take place in multi-well plates made of polystyrene, with polypropylene and polycarbonate being viable alternatives. These plastics are chosen because protein binds well to them, which can be further enhanced by gamma-irradiating the plates to impart a positive charge. Standard polystyrene plates will bind 100-200 ng IgG/cm2, while “high-binding” plates will bind up to 400-500 ng IgG/cm2. It is important to use plates that are designed for ELISAs to ensure consistency and to minimize edge effects (higher or lower optical density (OD) in peripheral wells compared to central wells). ELISA plates should show less than 5% intrasample variation across different plates.
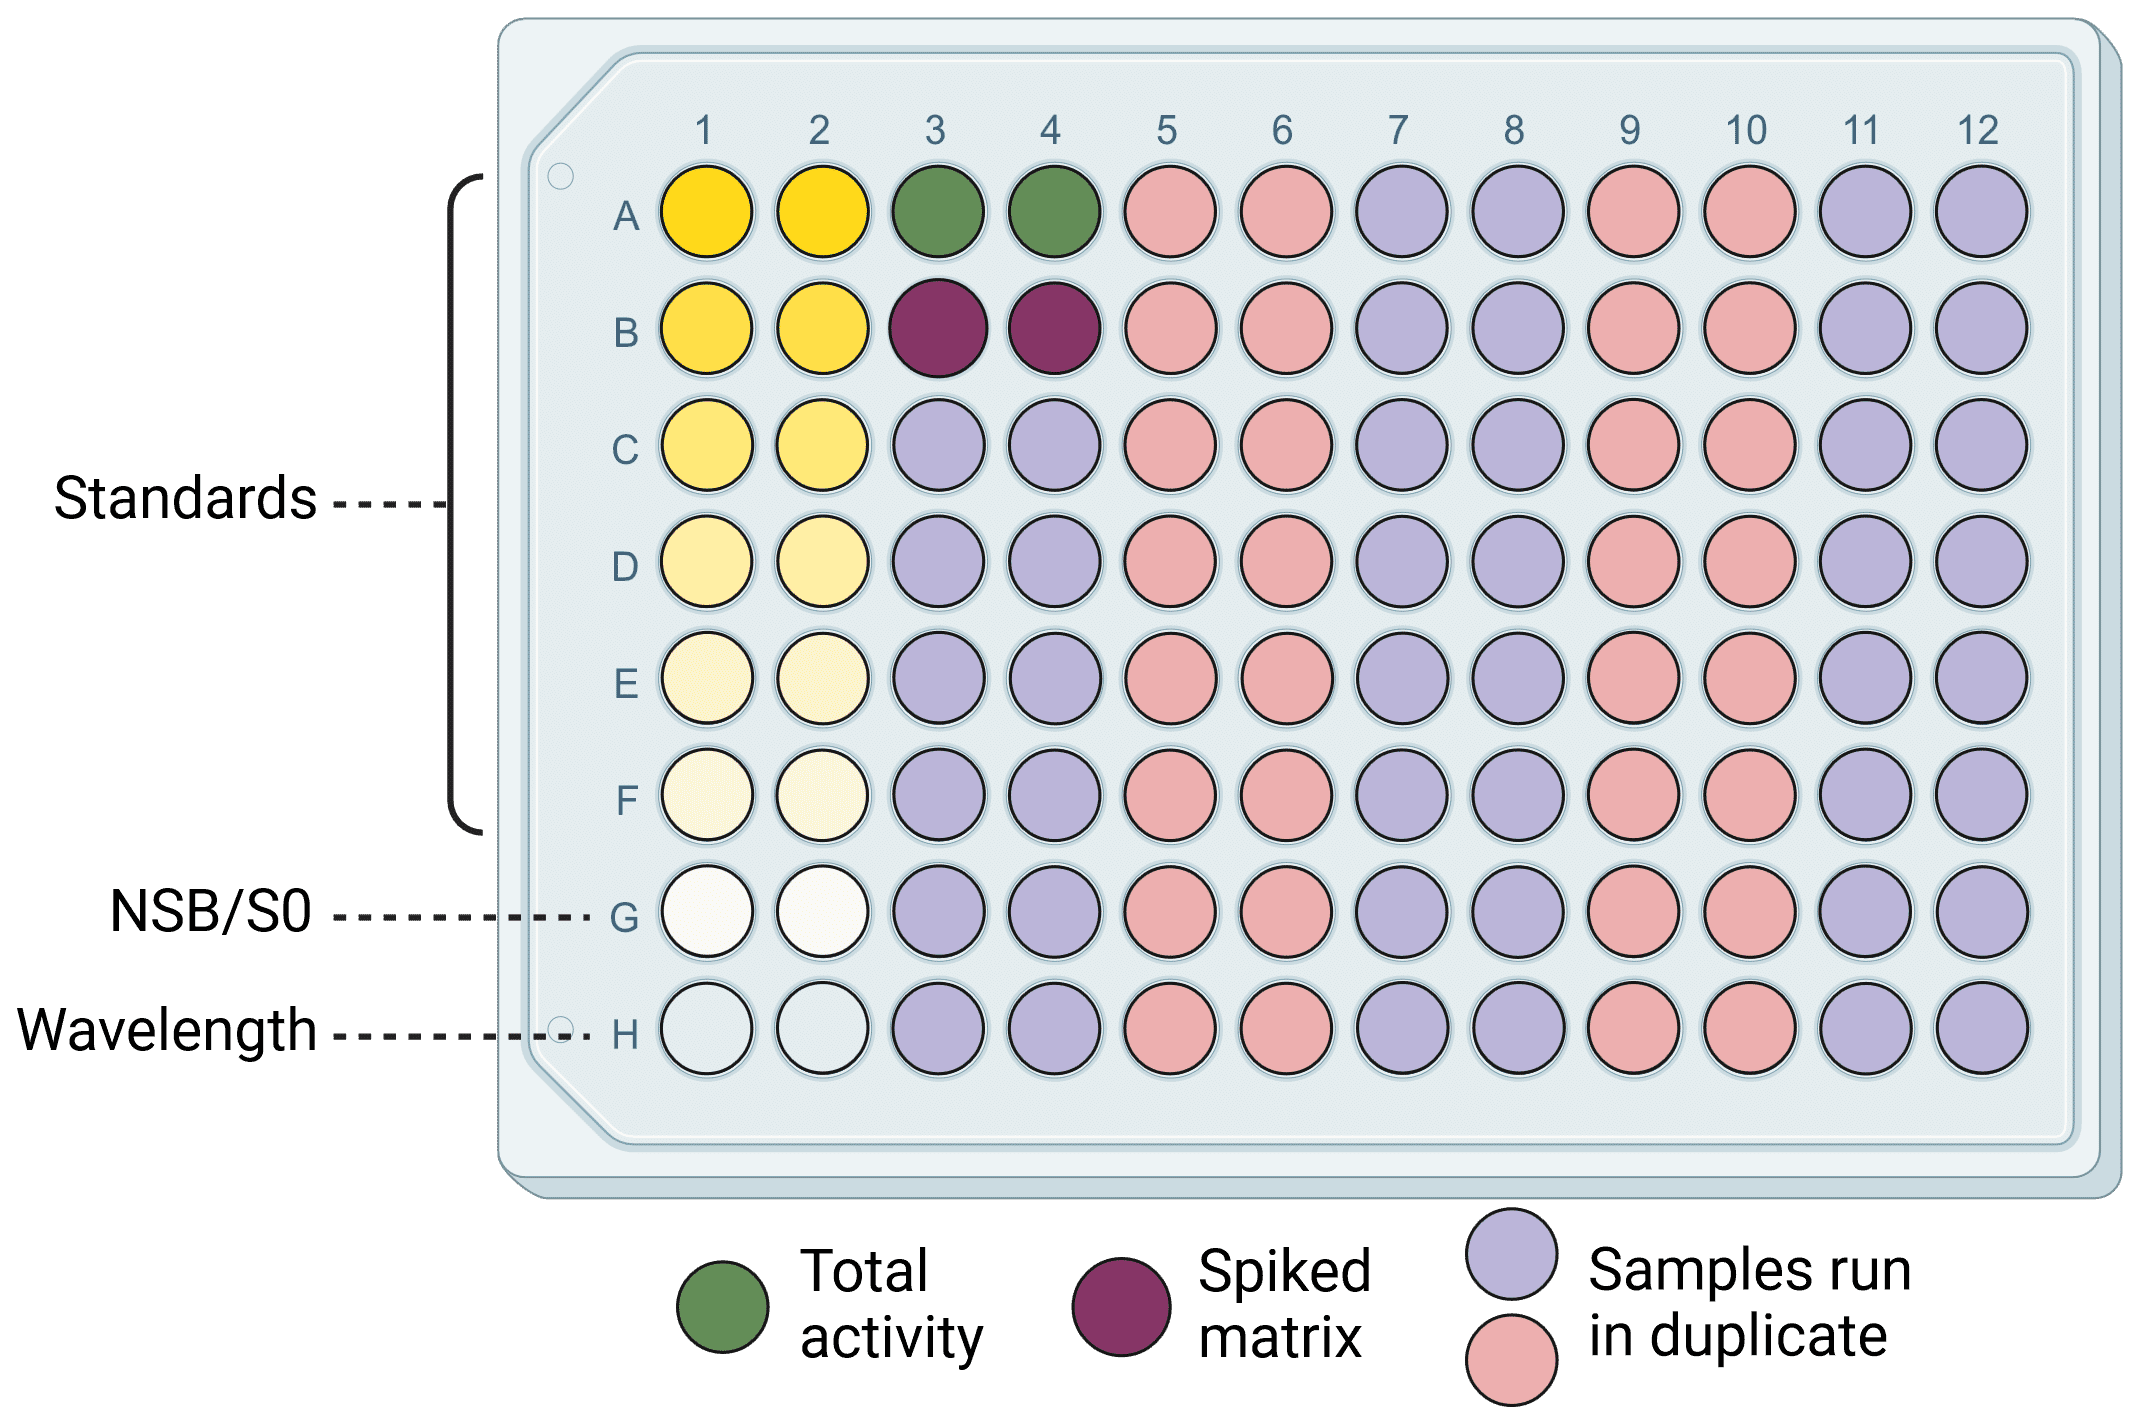
The most common format is for plates to have 96 wells, though 8- and 12-well strips can be used as well for greater flexibility. 96-well plates allow for standard curves, controls and a large number of samples to be run simultaneously (Figure 3), and can be used in conjunction with multichannel pipettes for consistent and fast results. Plates bearing the same physical footprint as 96-well plates but containing 384 or 1536 wells enable users to process many more samples, but would usually require automated sample handling as would be found for high-throughput screening.
Figure 3: An example ELISA plate layout. Wells include standard dilutions to generate a standard curve, negative (NSB/SO and wavelength) and positive (total activity and spiked matrix) controls, and 38 samples. Everything is run in duplicate for greater accuracy and reliability.
Coating refers to adsorbing a protein to the plastic surface of the ELISA plate. In many cases now, plates will come pre-coated with antibody or antigen (depending on the application) when purchased from commercial sources, particularly if performing sandwich and competitive ELISAs. If available kits are not suitable for an application, however, then coating the plate in-house will be necessary.
Most coating is achieved through passive adsorption, which is mediated by hydrophobic and electrostatic interactions. Time and temperature of the coating procedure, the pH of the coating buffer, and concentration of the coating protein can all influence the coating efficiency. A typical coating procedure might involve diluting the coating protein in coating buffer at 1-10 μg/ml, adding 50-100 μl per well, and incubating overnight at 4°C or for 1-3 hours at 37°C. A common coating buffer is 0.2 M sodium carbonate/bicarbonate pH 9.4. The high PH enhances protein solubility and results in most proteins having an overall negative charge, to bind to the positively charged plate. Phosphate-buffered saline (PBS) and Tris-buffered saline (TBS) can also be used, but binding will likely be less effective. Testing a range of concentrations of the coating protein is recommended to ensure that enough, but not too much, protein is deposited. Optimal coating will result in the highest sensitivity: undercoating may mean that low abundance antigens are not detected or result in high non-specific binding of the sample to the plate, while overcoating may result in oversaturation of the wells, reducing antibody binding by steric hindrance.
Passive coating may not be sufficient for all applications.14 A good example of this is for oriented coating of antibodies, which enhances the antigen-binding Fab region availability and therefore can increase ELISA sensitivity. In this instance, antibodies can be captured via their Fc region by coating a plate with Protein A or Protein G, immunoglobulin-binding proteins from in Staphylococcus aureus and Streptococcus sp., respectively. However, cross-reactivity can be an issue as detection antibodies can also be bound by Protein A/G. One alternative is the immobilization of antibodies on nickel- or copper-coated plates, which often have histidine-rich sequences in their Fc domain. Capturing oriented antibodies with chromium has more recently been shown as a viable alternative.15 Nickel and copper capture can be applied to any protein that has been tagged with histidine. Plates that have been precoated with streptavidin will similarly bond biotinylated antibodies or antigens with high affinity, though this can result in high background due to endogenous biotin in samples. Finally, small peptide molecules often do not coat plates well by passive adsorption, and so can be coated onto maleic anhydride or maleimide-activated plates, which interact with primary amine and sulfhydryl groups in the peptides, respectively.
A wide variety of biological sample types can be assayed by ELISA, including cell culture supernatants, cell or tissue extracts, and biological fluids such as blood, serum, plasma, and saliva. Samples can be assayed either by binding them directly to the plate and then probing with an antibody (direct/indirect ELISA), or they can be incubated with a plate-bound antibody (sandwich ELISA). The purity of the sample may dictate which type of ELISA is suitable. A complex and heterogeneous sample, such as blood, will be best suited to competitive or sandwich ELISA. This is because a crude mixture will give too much background noise with a direct or indirect ELISA, due to off-target protein interference. For direct/indirect ELISAs, an antigen should be enriched (e.g. through overexpression) in the sample, representing >3% of the total protein content.
For all samples, the protein extract should be ~1-2 mg/ml, they should be stored after processing at -80°C to avoid protein degradation, and should be centrifuged after thawing at 10,000 rpm for 5 minutes at 4°C to remove precipitate before use that could interfere with the assay. When running the ELISA, samples should be tested in duplicate or triplicate alongside a known standard dilution series (see Standards below) to ensure the accuracy of results. If the concentration of the target antigen is completely unknown, it is recommended to test a few dilutions of the sample (e.g. diluting from the original sample 3x, 10x, 30x, 100x, 300x) to make sure it falls within the linear portion of the standard curve. Diluting samples in a buffer such as PBS with 0.05% Tween-20 and 0.1% BSA is recommended to help with matrix effects (see Standards below), and to achieve appropriate sample concentration such that it falls within the linear range of the standard curve. Serum, plasma, cell and tissue extracts should be diluted at least 50% due to the complexity of their constituents. Blood and serum can additionally contain heterophilic antibodies, anti-animal antibodies, complement factors, and other endogenous components, which can lead to unexpected cross reactivity in ELISAs. Special buffers are sometimes needed to dilute these.
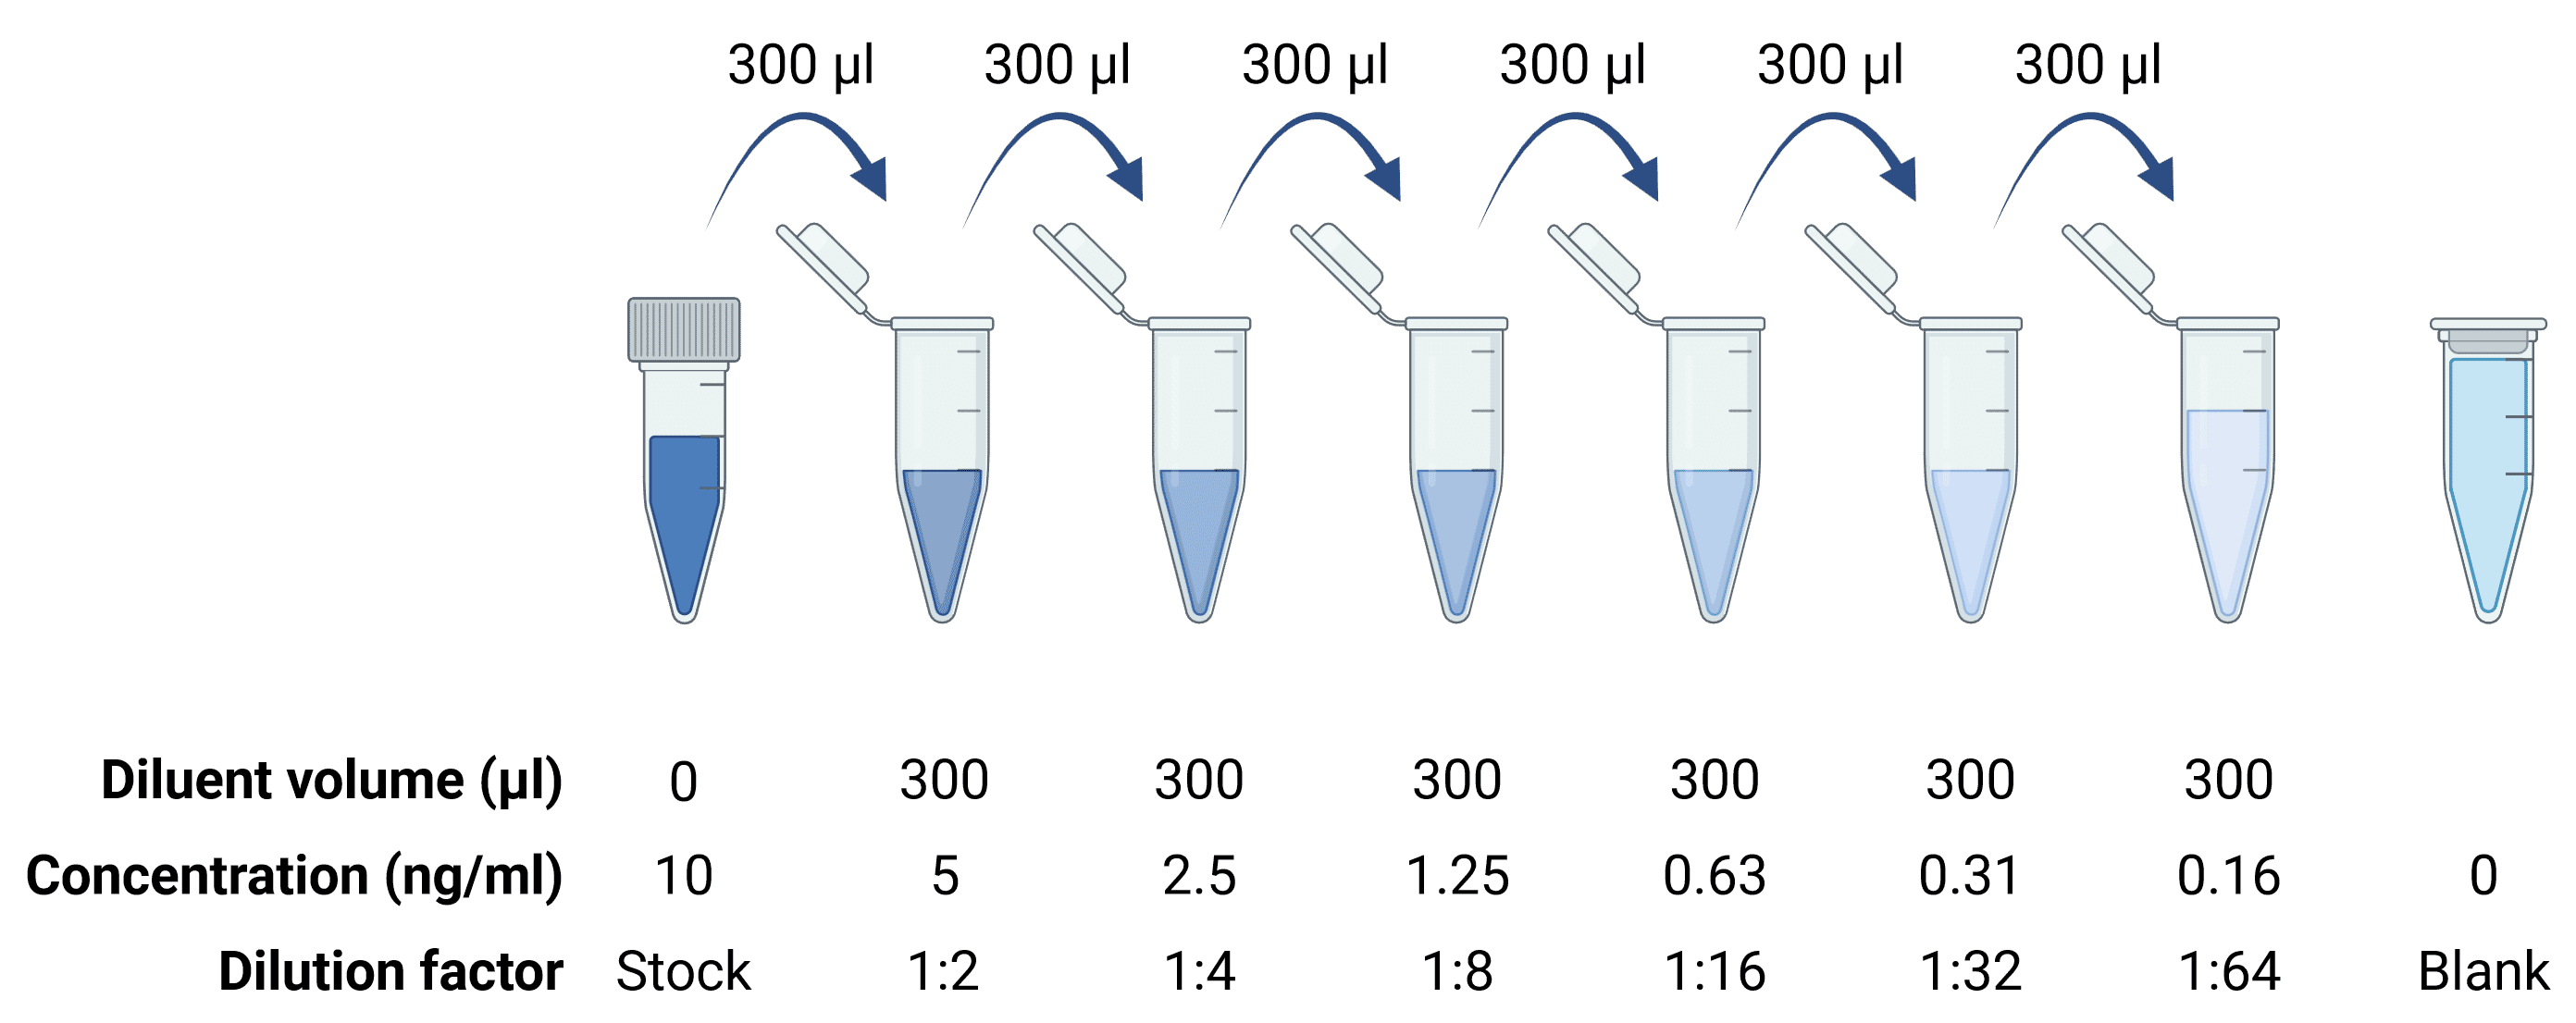
Calculating protein concentration from an ELISA requires simultaneously assaying known quantities of protein alongside the experimental samples for later comparison (see Standard Curve). Standards are usually provided as lyophilized powders, which must then be reconstituted according to the product manual to get a stock protein solution of known concentration. This is then serially diluted to generate the standard curve (Figure 4), which should cover the upper and lower ends of the expected concentration range for the samples. Dilutions should be prepared using low-binding tubes (e.g. not in wells of the ELISA plate) to minimize protein loss from protein binding to the tube between each dilution. Stock solutions should be aliquoted and stored at -20°C or below to avoid freeze-thaw cycles.
Figure 4: Serial dilutions to generate a standard curve.
Antigens derived from a complex biological sample, also called a sample matrix, such as blood or serum, will be in the presence of other components in the sample matrix, such as heterophilic antibodies, anti-animal antibodies, and complement factors. Such components can affect antibody binding and thereby introduce false negative or false positive signal, compared to the standard control that is only in standard diluent. These issues are known matrix effects. To test if matrix effects are affecting an ELISA, a spike and recovery experiment can be performed. Here, a known amount of standard is spiked into the sample matrix and into a standard diluent, then ELISA results are compared. If the results are different, that suggests that the sample matrix is interfering with antibody binding in some way. This can be fixed either by generating the standard curve using standard concentrations that have been diluted in the sample matrix (e.g. dilute in cell culture medium if the sample is culture supernatant), or to alter the samples themselves, such as by diluting them in standard diluent. This will reduce the influence of interfering factors on the ELISA, and complex samples such as blood or serum should always be diluted at least 50% for this reason.
Blocking is an essential step in an ELISA to reduce background signal. ELISA plates are designed to enhance protein binding, and, unfortunately, detection antibodies are no exception, and can bind to empty plate space that is not occupied by sample or antibody during the initial plate coating step. Blocking is when this empty space is instead occupied by other proteins, such as bovine serum albumin (BSA). This is typically achieved by incubating the plate with 1% BSA or milk proteins in PBS for 1 hour at 37°C, after the plate coating step. If cross-reactivity is observed (e.g. if the detection antibody binds to BSA), a different blocker should be tested, particularly non-mammalian blockers such as salmon serum or a protein free blocking solution.
Tween-20 is a detergent and is often added as an additional blocking agent, but, unlike blocking proteins, Tween-20 will not bind strongly to the plate and can be washed away. Instead of occupying space on the ELISA plate, Tween-20 is added because it promotes dissociation of weakly bound molecules, reducing non-specific binding.
Washing removes unbound or weakly bound reagents to reduce non-specific binding. ELISAs often require 5 washes and a large volume of wash buffer to ensure that all components from previous steps have been removed before moving on to the next stage. Automated plate washing can be quicker and more effective than manual washing, and may reduce the risk of the plate drying out, which substantially increases background signal.
Selecting the correct antibody is essential for a successful ELISA with low background and high sensitivity. The antibody should be validated for specific ELISA applications, because immobilization of antigens may alter protein conformation, altering the recognized epitope or sterically hindering access to it (this is not an issue for sandwich ELISAs). The antibody should also be highly specific for the target antigen, with as little recognition of non-target molecules as possible.
Validation of the antibody’s reactivity is also essential, ensuring that the antibody will recognize the target protein from the species under investigation. Primary antibodies (e.g. capture and detection antibodies) will only recognize antigens only from certain species, which will be the species that the immunizing antigen was originally from, as well as closely related species. The key determinant of this is how similar the epitope sequence is between species, allowing researchers to predict if an available antibody will work in a non-validated species.
For sandwich ELISAs, at least two antibodies are needed, which need to recognize different epitopes and not interfere with the other’s binding; complementary antibodies are referred to as “matched pairs”. Indirect sandwich ELISAs add an extra antibody, which can increase the chance of cross-reactivity. This secondary antibody should only recognize the detection antibody, not the capture antibody, necessitating that the matched pair be derived from different host species. Antibody concentration must also be optimized to find the optimum signal-to-noise ratio. The substrate used for detection will affect this, with some substrates being more sensitive.
Monoclonal antibodies recognize a single epitope on a given antigen. This reduces background because they are less likely to recognize non-target molecules. They are commonly used when designing matched pairs in sandwich ELISAs because the binding site is known, making it easier to find two complementary antibodies. Having said that, monoclonal antibodies can be used in conjunction with polyclonal antibodies in sandwich ELISAs. In this case, the monoclonal should be the capture antibody because its binding site might be blocked by a polyclonal antibody if used as the detection antibody, resulting in loss of signal. This is less likely to happen the other way round as polyclonal antibodies can recognize more epitopes.
Unlike monoclonals, polyclonal antibodies recognize multiple epitopes on an antigen. They can vary significantly in their sensitivity from batch-to-batch, so must be re-tested each time a new batch is acquired, but they are also able to give a stronger signal. Polyclonals are more robust to antigen conformation changes, because recognition site is likely to still be accessible. However, they may also be more likely to bind off-target proteins. Antibodies from the same polyclonal batch can both capture the analyte and subsequently also detect it in sandwich ELISAs, but this requires testing and optimization.
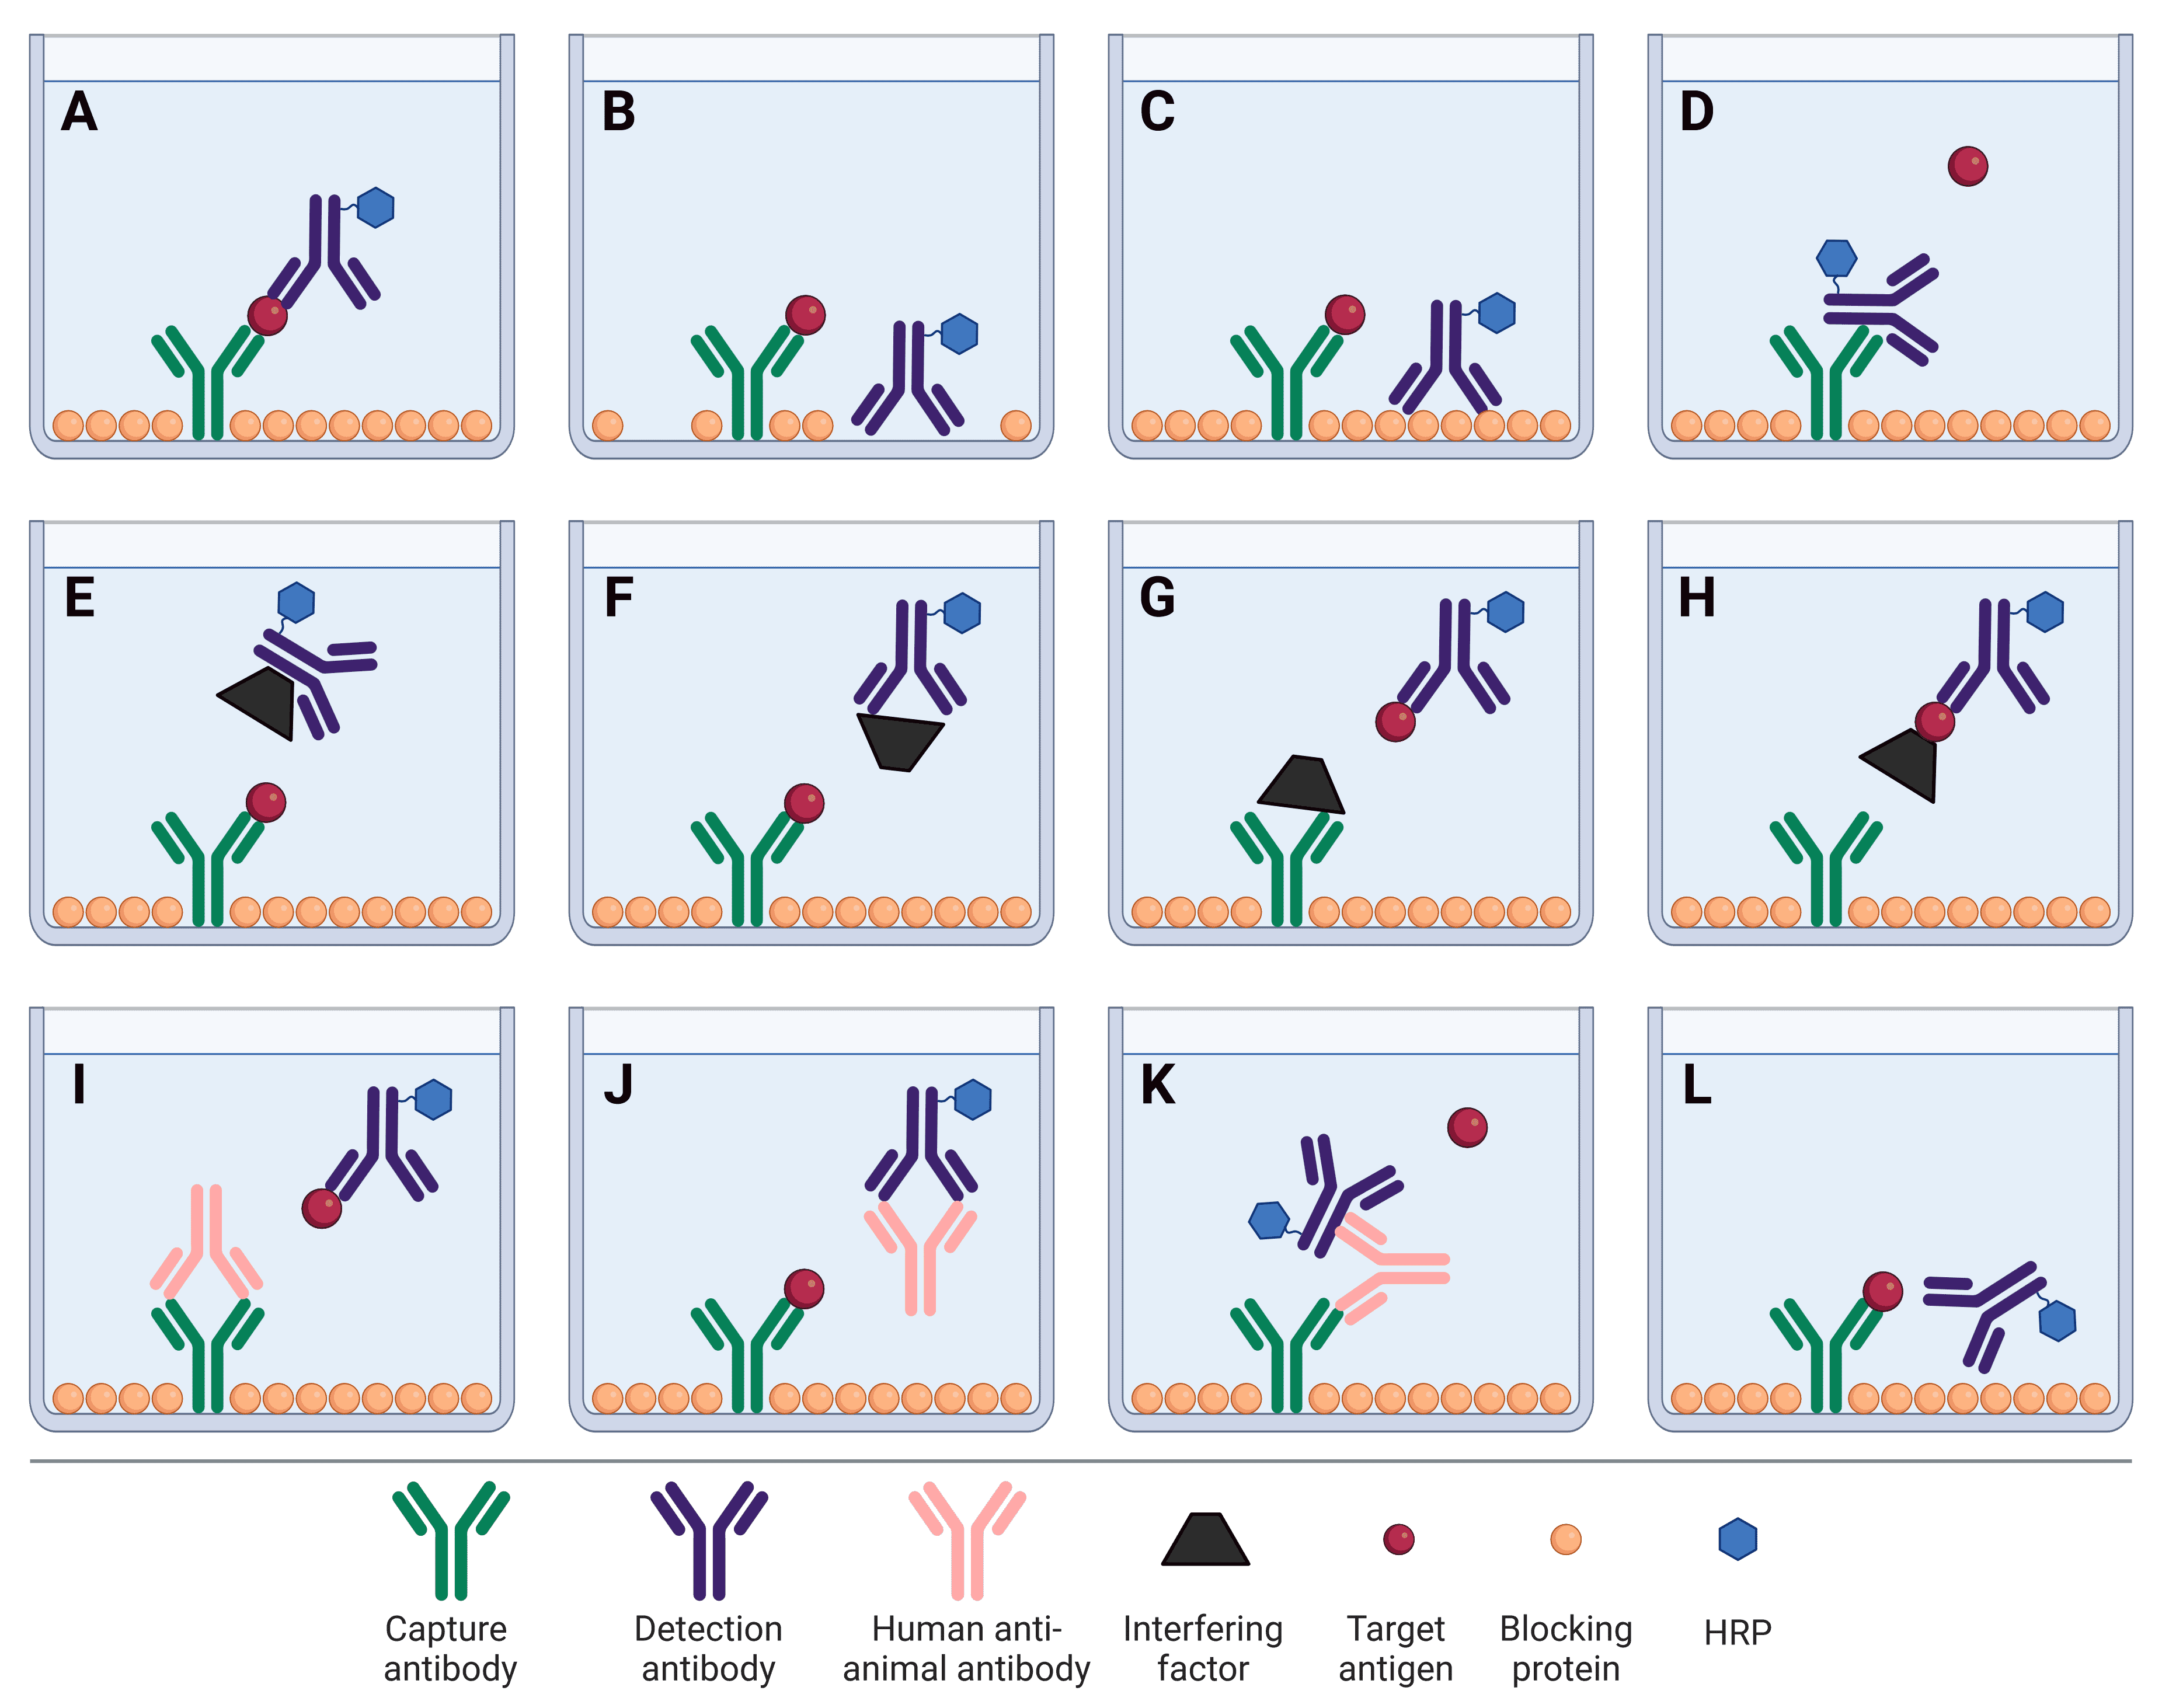
As described above, numerous factors can influence the signal intensity and background levels in an ELISA, particularly off-target binding. This binding can occur between any protein components within the sample or ELISA workflow, including capture and detection antibodies, and interference factors in a complex sample matrix. These off-target binding events are described in Figure 5.
Figure 5: Factors affecting sandwich ELISA signal and background. A, The ideal scenario: capture and detection antibodies bind the target antigen with high specificity. B, Detection antibody binds to plate due to insufficient blocking. C, Non-specific binding of the detection antibody to blocking proteins. D, Capture antibody binds to the Fc region of detection antibody, preventing the analyte from binding. E, An interfering factor present in the sample matrix binds the Fc region of the detection antibody, sterically hindering it from binding to the analyte. F, Cross-reactivity of an interfering factor with the detection antibody, preventing it from binding to the analyte. G, Cross-reactivity of an interfering factor with the capture antibody, preventing it from binding to the analyte. H, Masking of the analyte by an interfering factor, blocking the analyte from being bound by the capture antibody. I, Heterophilic antibody or human anti-animal antibody (HAAA) blocks capture antibody from binding analyte. J, HAAA blocks detection antibody from binding analyte. K, HAAA acts as a bridge, binding both the capture and detection antibodies. L, Non-optimized matched pair of antibodies that are sterically hindered from simultaneously binding to their target epitopes. B, C, D and K will result in false positive signal. E-J and L will result in false negative signal.
ELISAs classically use colorimetric systems for signal detection, in which a colored compound is produced following catalysis of a substrate by an enzyme (usually HRP or AP). Colorimetric detection also benefits from requiring comparatively cheap plate readers that may already be available in a lab.
Chemiluminescence is the most sensitive of the three detection systems, able to detect sub-picogram protein concentrations, and relies on the production of light as a product of enzyme- (usually HRP-)mediated catalysis of a substrate. Luminol is a common substrate, which is oxidized to 3-aminophthalate in the presence of HRP and hydrogen peroxide. However, unlike the colored compound produced by colorimetric systems, light is only present while the reaction is occurring. Once the substrate is exhausted, the signal stops. The light is measured using a luminometer or a plate reader with luminescent capabilities.
Fluorescence works by directly labeling an antibody with a fluorophore, which is excited by a specific wavelength (or range of wavelengths) of light, and will then emit light at a slightly longer wavelength. The continued reliance of ELISAs on colorimetry is different from IHC and ICC, where fluorescence has become the norm. In part this is due to the strong advantages for multiplexing (probing for multiple antigens at the same time) that fluorescence offers. Multiplexing is far more common in immunostaining than it is in ELISAs, though ELISA multiplex arrays are becoming more popular, allowing researchers to assay the levels of multiple antigens at once using fluorescence.
Multiplex arrays have can have several advantages over standard ELISAs. Assaying multiple antigens at once can save significant time when compared to performing the standard ELISAs required for an equivalent number of analytes. Similarly, multiplexed arrays tend to be more cost effective when analyzing more than a few distinct analytes, though they require more expensive equipment for analysis and present a larger up-front cost. Finally, given that samples such as patient blood samples may already be limiting, the reduced sample requirements of multiplexed arrays are attractive.
Multiplex arrays usually rely on the principle of sandwich ELISAs to capture antigens from samples, although using a traditional ELISA format to identify antibodies in patient samples by coating plates with antigens is useful in clinical settings.16 Multiplexed assays can either be in the form of spots printed at precise locations on a slide or in a well, where each spot holds a different capture antibody, or make use of flow cytometry and attach capture antibodies to dyed beads in solution.17 To distinguish analytes from each other, printed arrays match the spot location on the slide or plate to the analyte, whereas flow systems mark each analyte-specific bead with a precise ratio of two fluorescent dyes. Both systems measure the amount of fluorescence (corresponding to the amount of bound detection antibody) to determine the amount of analyte present in a sample.
While the same enzymes (HRP and AP) are used in ELISAs as in IHC, the enzyme substrates differ. Unlike in IHC, precipitating substrates are not used for ELISAs because the precipitate can settle in the well and affects absorbance measurements. Colorimetric substrates result in a soluble, stable, colored product that accumulates proportionally to the amount of enzyme (and therefore bound antibody) in each well. A stop solution can often be added to prevent the reaction from continuing and provide a fixed end point to the experiment.
The substrate for HRP is hydrogen peroxide (H2O2). Cleavage of hydrogen peroxide can be coupled to oxidation of a hydrogen donor, resulting in a color change. When using HRP in ELISAs, 3, 3', 5, 5'-tetramethylbenzidine (TMB) is the most common substrate. TMB produces a blue color in the presence of HRP and H2O2, and the reaction can be stopped by acid, e.g. sulfuric acid, which also changes the color from blue to yellow, for which absorbance is measured at 450 nm. Not only is the yellow color more stable, it also has stronger absorbance, increasing sensitivity. HRP is often preferred to AP because the reaction is faster.
The substrate for AP is p-Nitrophenyl Phosphate (pNPP), which produces a soluble yellow product for which the absorbance can be measured at 405-410 nm.
| Enzyme | Substrate | Absorbance peak | Notes |
|---|---|---|---|
| HRP | TMB (3,3′,5,5′-tetramethylbenzidine) | 450 nm | Light-sensitive Strongest absorbance, particularly after addition of stop solution Changes from blue to yellow on addition of stop solution Most commonly used |
| OPD (o-phenylenediamine dihydrochloride) | 492 nm | Light-sensitive Changes from yellow to orange on addition of stop solution | |
| ABTS (2,2'-azino-di-[3-ethyl]-bensothiazoline-6 sulfonic acid) diammonium salt | 416 nm | Light-sensitive Remains green on addition of stop solution Lowest sensitivity of HRP substrates | |
| AP | pNPP (p-Nitrophenyl Phosphate) | 405 nm | Slower color reaction than HRP substrates Color remains yellow on addition of stop solution |
Table 3:Comparison of different substrates used in ELISAs.
ELISAs are most useful for providing researchers with a quantitative measure of protein abundance in a sample. To calculate this, absorbance measurements are compared to a standard curve (see below) and the target protein concentration is interpolated.
A simpler format of ELISA can also provide a qualitative answer indicating whether an antigen is present in a sample or not. Here, the samples need only be compared to a blank (negative control) and a single positive control known to be expressing the antigen, ideally at a low level to serve as a lower threshold for antigen detection.
Finally, ELISAs can also be semi-quantitative, in which the analyte concentration in a sample is compared in relative terms to a positive control.
A standard curve allows the determination of analyte concentration in unknown samples. A known amount of purified protein is serially diluted and assayed alongside unknown samples. The standard curve is generated by plotting the absorbance of the standard wells against the known protein concentration. To plot the standard samples, replicates representing the same concentration of standard should be averaged, and then subtract the reading of the blank control. Absorbance values from the unknown samples can then be compared (within the linear portion of the standard curve) to interpolate protein concentration, taking into account any dilutions made to the samples.
While a standard curve can be created by simply drawing straight lines between points, this type of curve will make no attempt to estimate the data between standards, and so may not be a good reflection of the true curve. Instead, plotting a standard curve usually requires modeling the standard data to generate an equation from which the concentrations of samples can be predicted. The type of model that is fit and how well that model fits will affect the accuracy of results (Figure 6).
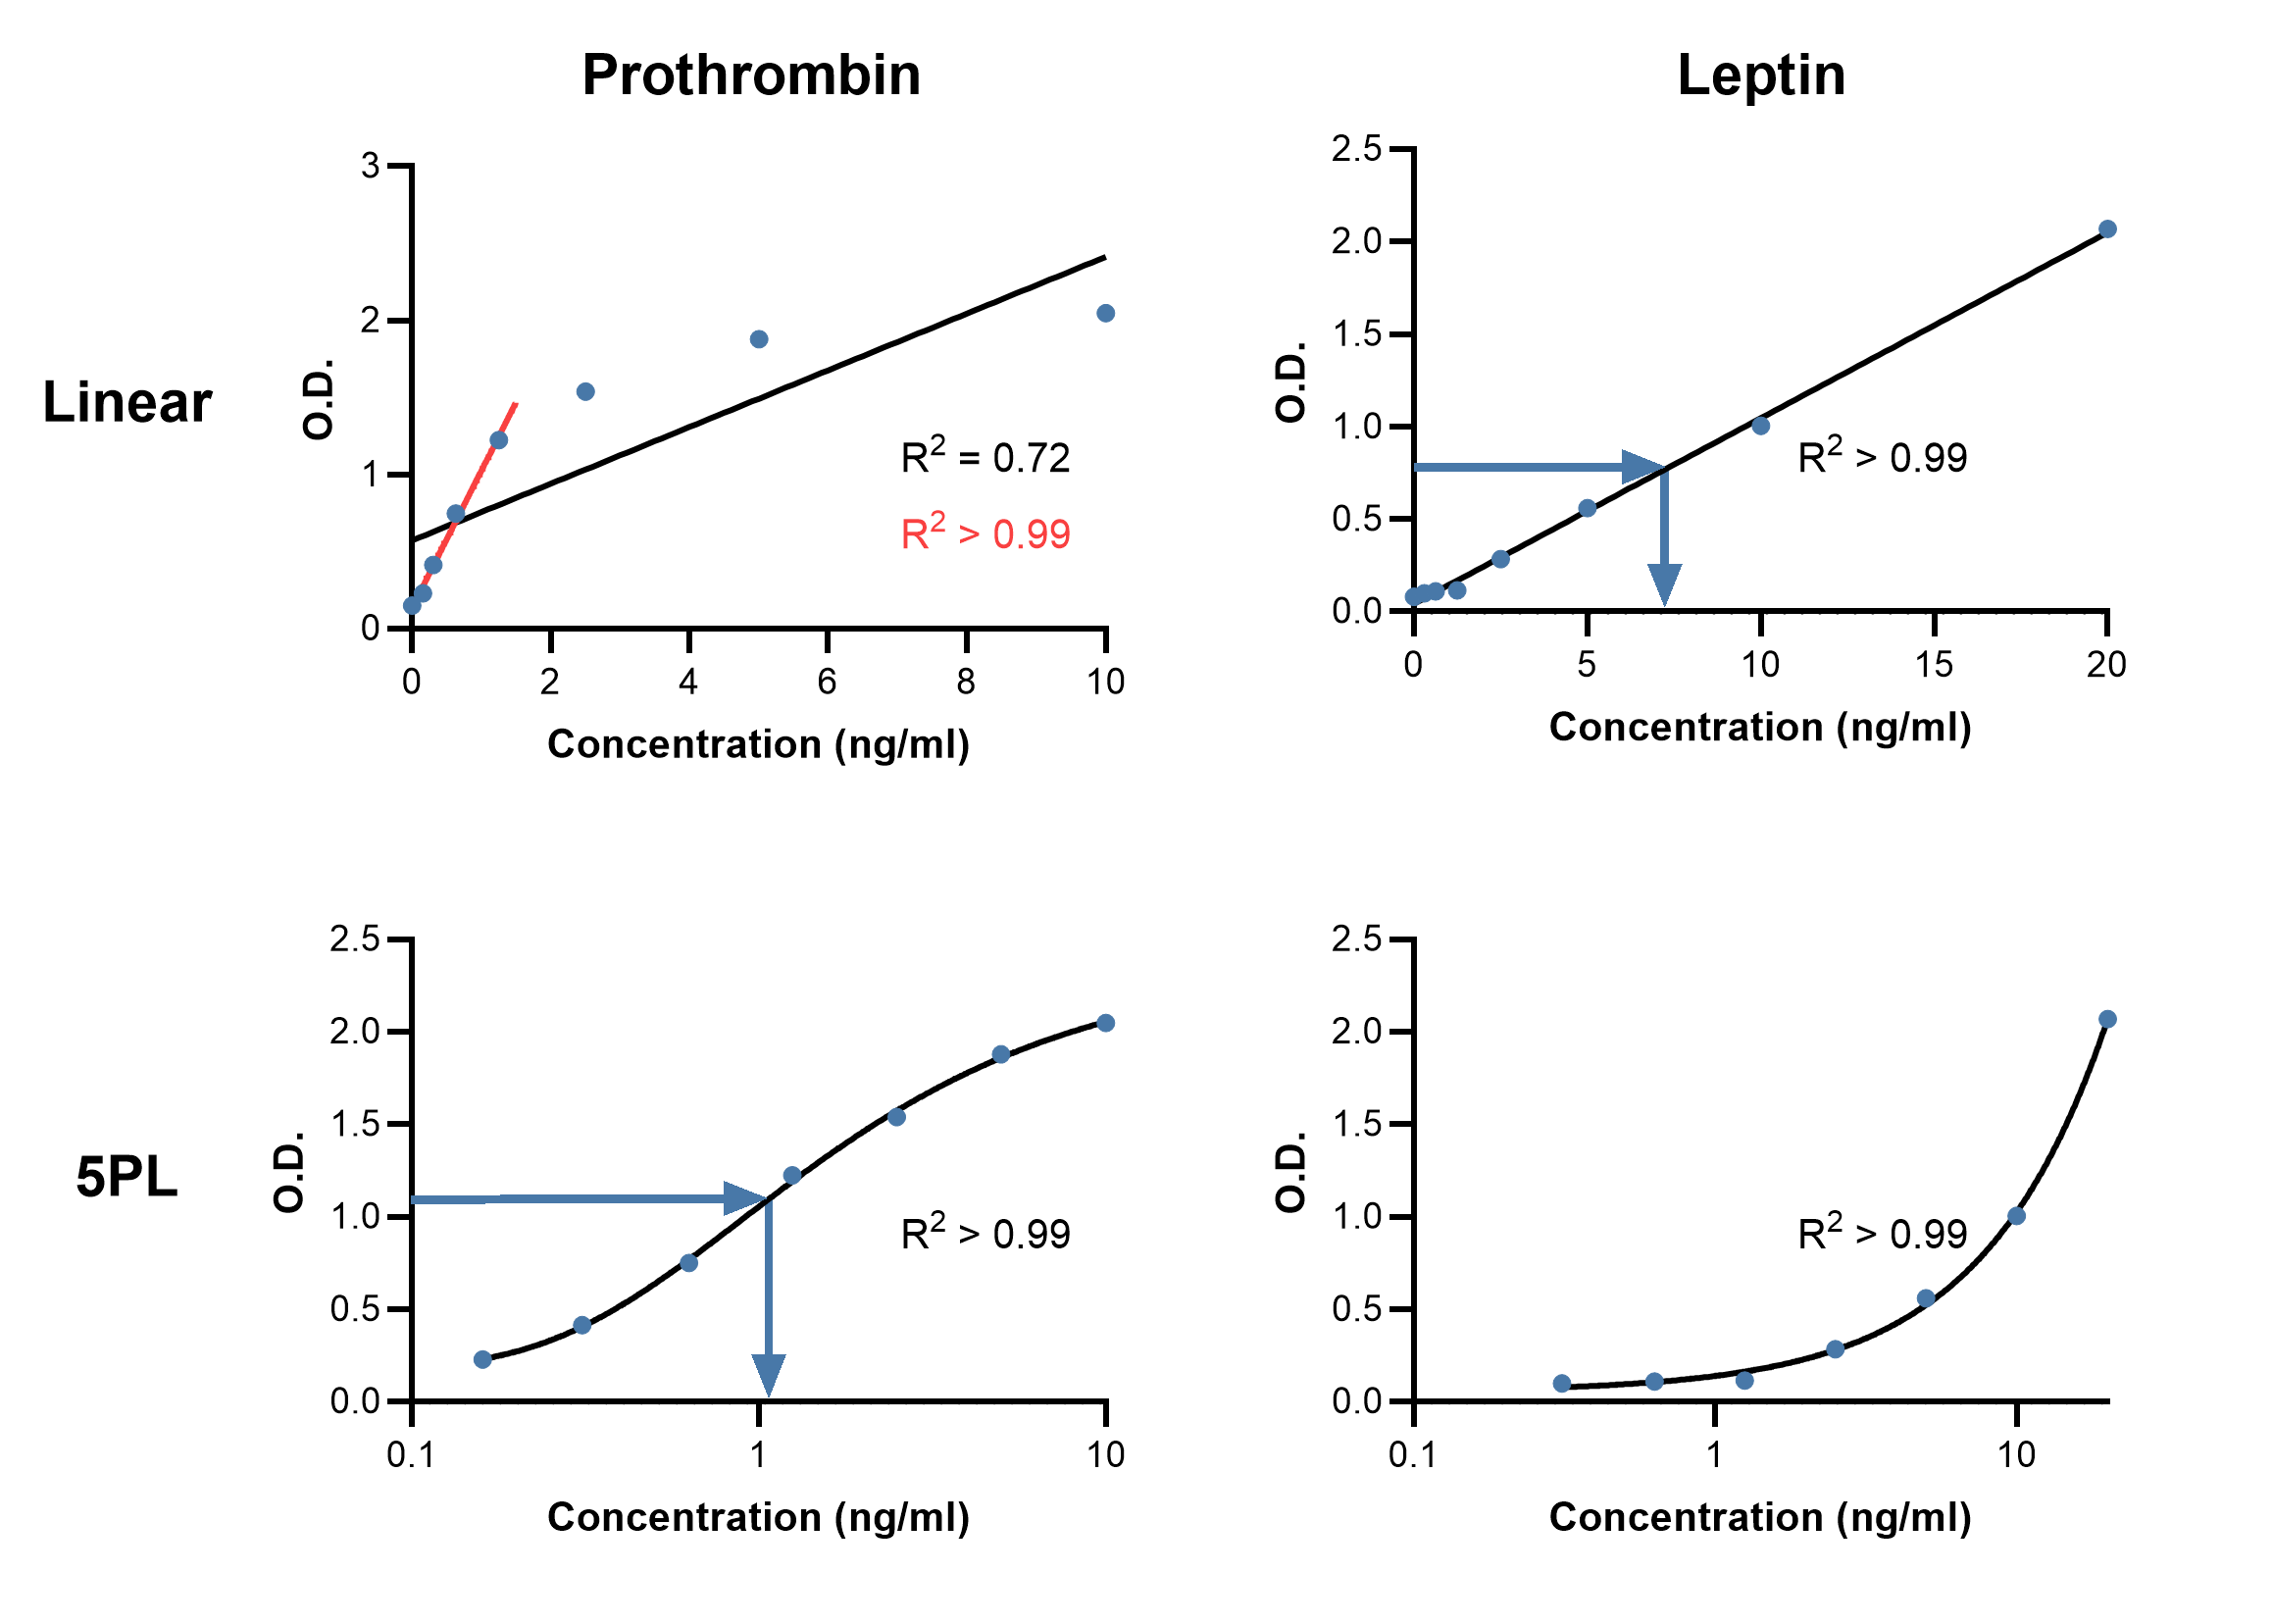
The simplest model to fit is a linear regression, which only uses the linear range of an assay. How well the model describes the data, termed the goodness of fit (GoF), can be determined by the R2 value, where R2 > 0.99 is considered as being a very good fit.
Using software that comes with many ELISA plate readers allows more advanced model fitting and can increase the usable range of a standard curve. The most common models to fit for immunoassays now are the 4- or 5-parameter logistic (4PL and 5PL) curves.18 The parameters that are calculated in 4PL models are: estimated response at zero concentration, slope factor, mid-range concentration (C50), and estimated response at infinite concentration.18 The extra parameter in 5PL is an asymmetry factor, allowing for situations in which the plotted curve does not have symmetrical tails at either end of the sigmoid, i.e. if concentrations have not been used to identify the plateaus at either end. A better fit in this case will be achieved with a 5PL model. In case a 4PL or 5PL fit is not available, plotting the log of the standard concentration against the log of the absorbance will also produce accurate determinations, though with a shorter range than 4PL/5PL.
Figure 6: Comparing standard curves using linear and 5PL curve fits. Example linear (top) and 5PL (bottom) curve fits using standard curve data from Rat Prothrombin ELISA Kit A86912 (left) and Human Leptin ELISA Kit A79497 (right). Goodness of fit is measured by R2. Linear fits may be suitable if the data is linear, such as for leptin, otherwise they may be constrained to fitting only a portion of the data (red line, prothrombin). Blue arrows indicate how to interpolate concentration of an unknown sample from an absorbance reading.
To determine GoF for these models, one intuitive approach is to backcalculate the concentration of standards from the curve (Table 4). This expected concentration can then be compared with the actual concentration and expressed as a percentage (i.e. (Observed/Expected) * 100). Expected values that fall within 20% of the actual values are desirable, though more stringent criteria can be used if necessary. Comparing the actual with the expected value for each standard can further reveal if one region of the curve poorly reflects the known concentrations and should not be used for reliable concentration determination.
| Concentration (ng/ml) | Standards recovery (Obs/Exp * 100) | |
|---|---|---|
| Linear | 5PL | |
| 0.16 | 38.15 | 100.00 |
| 0.31 | 65.83 | 101.22 |
| 0.63 | 108.80 | 97.40 |
| 1.25 | 152.48 | 102.94 |
| 2.5 | 149.02 | 98.09 |
| 5 | 125.89 | 101.08 |
| 10 | 84.94 | 100.49 |
Table 4:Comparison of the recovery of standards using linear and 5PL curve fits. Data from Rat Prothrombin ELISA Kit A86912. Shaded cells indicate recovery range of 80-120%.
The dynamic range is the range over which an analyte can be accurately and reliably quantified. To determine the dynamic range, plot the standard curve of protein concentration against absorbance. The region in which the assay is reliable will show a strong correlation between the antigen and the signal, and will show little variability between standard replicates. Samples containing concentrations of the antigen that are too high can be diluted down such that the concentration falls within the dynamic range.
The coefficient of variability (CV) represents the consistency of the ELISA, usually between plates (inter-assay) or between duplicates run in the same experiment (intra-assay). Inter-assay CV should be less than 15%, while intra-assay CV should be less than 10%.
As described in Standards, the percent recovery indicates how much the sample matrix affects ELISA performance. A known amount of standard is spiked into the sample, and then the absorbance measurements for that spiked sample are compared to the standard curve. If they match, this would indicate a 100% recovery, while a lower signal suggests that interfering factors in the sample matrix are affecting antigen detection.
Diagrams created with BioRender.com.