Rachel Stewart, PhD | Last updated: 26th September 2025
The western blot is a technique that uses antibodies to detect specific proteins on a membrane that have been separated by gel electrophoresis. This allows determination of protein size or changes in size, relative abundance, protein complex formation, and post-translational modifications (PTMs) to proteins.
This guide aims to provide a comprehensive overview of western blot experimental considerations, optimization, protocols and troubleshooting to aid in achieving research objectives using the western blot technique.
It may be surprising to learn that the history of the western blot only stretches back to the late 1970s. In fact, essential western blot methodology, including sodium dodecyl sulfate polyacrylamide gel electrophoresis (SDS-PAGE)[1] and monoclonal antibodies with antigen specificity,[2] were only established in 1970 and 1975, respectively. In 1975, Edwin Southern invented the eponymously-named “southern blot”, a technique in which DNA fragments are separated through electrophoresis based on their size and then transferred to a nitrocellulose membrane for detection.[3] This method was quickly followed two years later by the invention of the “northern blot”, which could detect specific RNA molecules using radio-labeled DNA probes.[4]
Inspired by the northern blot, W. Neal Burnette, a postdoc at the Fred Hutchinson Cancer Research Center, developed a method for visualizing proteins separated by SDS-PAGE using monoclonal antibodies. He subsequently termed this method the “western blot”, in a nod to its predecessors. Interestingly, the manuscript detailing this technique was initially rejected, with reviewers criticizing the method’s name as “flippant and frivolous whimsy”.[5] Despite this, the paper was widely circulated and eventually published in 1981.[5] The research groups of George Stark at Stanford University and Harry Towbin at Friedrich Miescher Institut in Switzerland published similar immunoblotting techniques at roughly the same time.[6,7] The western blot, also commonly known as immunoblot, has since become an essential and ubiquitous technique in biology and medical labs around the world.
Western blotting relies on the electrophoretic separation of proteins from a complex mixture based on their mass, the transfer of these proteins to a solid matrix, and the detection of specific proteins of interest on the matrix using antibodies.
Western blotting requires a lysate, obtained from a sample of cells or tissues. Once soluble material has been obtained from the lysate, it is then subject to gel electrophoresis, allowing the proteins in the mixture to be separated according to their size. The proteins are then transferred to a solid-phase membrane. A specific protein of interest is then detected on the membrane using antibodies that recognize an epitope in the target protein, which in turn are detected by horseradish peroxidase (HRP)-conjugated secondary antibodies, and a chemiluminescent-based detection substrate.
Figure 1: The flow-through of a typical western blot experiment.
Sample Lysis
A number of protein-containing samples can be applied to immunoblotting, including: whole cell extracts, tissue extracts, and subcellular fractions. Tissue samples are more difficult to prepare, as they must be homogenized or sonicated to ensure cell lysis, and additional specialized preparation techniques may be required. In all cases, the cells must be lysed and the proteins solubilized. Once lysis begins, enzymes that can induce proteolysis and dephosphorylation are released, as such, lysis is typically performed on ice and in the presence of protease inhibitors (Table 1), to prevent protein degradation, and phosphatase inhibitors (Table 2), to prevent dephosphorylation.
| Protease Inhibitor | Targets | Stock |
|---|---|---|
| Aprotinin, 2 µg/ml | Trypsin, Chymotrypsin, Plasmin | Dilute in water to 10 mg/ml; freeze aliquots. |
| EDTA, 1-10 µg/ml | Mg2+ and Mn2+ metalloproteases | Dilute in deionized water to 0.5M. |
| EGTA, 1 mM | Ca2+ metalloproteases | Dilute in deionized water to 0.5M. |
| Leupeptin, 1-10 µg/ml | Lysosomal proteases | Dilute in water; freeze aliquots. |
| Pepstatin A, 1 µg/ml | Aspartic proteases | Dilute in methanol to 1 mM; freeze aliquots. |
| PMSF, 1 mM | Serine proteases | Dilute in isopropanol; freeze aliquots. |
Table 1: Common protease inhibitors included in lysis buffer.
| Phosphatase Inhibitor | Targets | Stock |
|---|---|---|
| β-glycerophosphate, 1-2 mM | Serine and threonine phosphatases | Dilute in water; freeze aliquots. |
| Sodium orthovanadate, 1 mM | Tyrosine phosphatases | Dilute in water; prepare in a fume hood. |
| Sodium pyrophosphate, 1-2 mM | Serine and threonine phosphatases | Dilute in water; freeze aliquots. |
| Sodium fluoride, 5-10 mM | Serine and threonine phosphatases | Dilute in water; freeze aliquots. |
Table 2: Common phosphatase inhibitors included in lysis buffer.
Choosing a Lysis Buffer
The formulation of the lysis buffer will depend on the subcellular location of the protein of interest, as well as on whether the antibody’s epitope is still present on the protein once it has been denatured. In general, denaturing conditions are used for cell lysis, however, if the antibody only recognizes the target protein in its native state, do not use SDS in the electrophoresis procedure and do not heat the sample. The epitope information and / or suggested immunoblotting conditions should be indicated on the antibody’s data sheet.
Distinct subcellular fractions of a biological sample can be isolated by varying the strength of the detergent in the lysis buffer (Table 3). NP-40 buffer or Triton X-100-containing buffer can be used to prepare whole cell extracts, cytoplasmic extracts, and membrane-bound extracts, however, hydrophobic proteins may remain insoluble under these conditions. Zwitterionic detergents, such as CHAPS, are better able to solubilize membrane proteins. RIPA (radioimmunoprecipitation assay) buffer, which contains SDS, is well suited for preparing whole cell extracts, membrane-bound extracts, and nuclear extracts, but disrupts protein-protein interactions.
In some cases, chaotropic agents that disrupt hydrogen bonding, such as 8M urea, can be used to isolate difficult to solubilize proteins,[8] however, these samples should not be heated as urea can be hydrolyzed to cyanate, which can chemically modify the protein sample.
| Subcellular Location | Buffer |
|---|---|
| Whole cell | NP-40 or RIPA |
| Membrane-bound proteins | RIPA |
| Cytoplasmic | Tris-HCl |
| Nuclear | RIPA or perform nuclear fractionation. |
| Mitochondria | RIPA or perform mitochondrial fractionation. |
| Cytoskeleton | Tris-Triton |
Table 3:Lysis buffer choice based on the target protein’s localization.
If native lysis conditions are required, proteins may be solubilized by varying the pH and ionic strength of the lysis buffer. Many proteins are soluble at a higher pH. High salt concentrations can also be used to promote protein solubility, although excess salt can produce wavy bands during electrophoresis. If a detergent-free lysis buffer is used, the sample should be homogenized using a Dounce homogenizer, sonicated, or passed through a 28-gauge needle. Lysates containing nuclear extracts should also be passed through a needle, sonicated, or treated with endonuclease to break down DNA and carbohydrates and reduce sample viscosity. Alternatively, protein samples may be purified and concentrated using TCA/acetone protein precipitation or buffer exchange.
If native lysis conditions are required, proteins may be solubilized by varying the pH and ionic strength of the lysis buffer. Many proteins are soluble at a higher pH. High salt concentrations can also be used to promote protein solubility, although excess salt can produce wavy bands during electrophoresis. If a detergent-free lysis buffer is used, the sample should be homogenized using a Dounce homogenizer, sonicated, or passed through a 28-gauge needle. Lysates containing nuclear extracts should also be passed through a needle, sonicated, or treated with endonuclease to break down DNA and carbohydrates and reduce sample viscosity. Alternatively, protein samples may be purified and concentrated using TCA/acetone protein precipitation or buffer exchange.
Determining Protein Concentration
Following lysis, the samples should be filtered or centrifuged to remove insoluble cellular debris. The total protein concentrations of the samples are then determined to facilitate equal loading onto the gel for electrophoresis. Protein concentration is determined using biochemical colorimetric or fluorescent-based assays in combination with a spectrophotometer. The BCA assay is compatible with detergents and denaturing reagents, but cannot be used in conjunction with reducing agents. The Bradford assay is compatible with reducing agents, but cannot be used with detergents. The Lowry assay is highly precise, but is incompatible with detergents and reducing agents, and is a lengthier process.[10]
Western Blots for Low Abundance Proteins
Some target proteins, such as many G protein-coupled receptors (GPCRs), are so lowly expressed that even a highly sensitive and specific antibody may not generate any signal on a western blot without prior enrichment. There are two main approaches to enriching for GPCRs:
Preparing Samples for PAGE
If the lysates will not be used immediately, store them in aliquots at -80°C. The protein samples are then appropriately diluted into sample buffer containing glycerol, to increase the sample density, and bromophenol blue, to observe migration of the sample through the gel. In addition, freshly added thiol reducing agents (DTT or β-mercaptoethanol) are typically used to reduce disulfide bonds and eliminate higher order structure in the protein samples. A standard sample buffer is 2X Laemmli buffer.[1] Alternatively, 4X or 6X recipes can be used to reduce dilution of the protein sample. The final protein concentration should be >0.5 µg/µl and between 3-5 µg/µl for optimum results. The protein sample can be concentrated through protein precipitation with TCA / acetone if necessary.
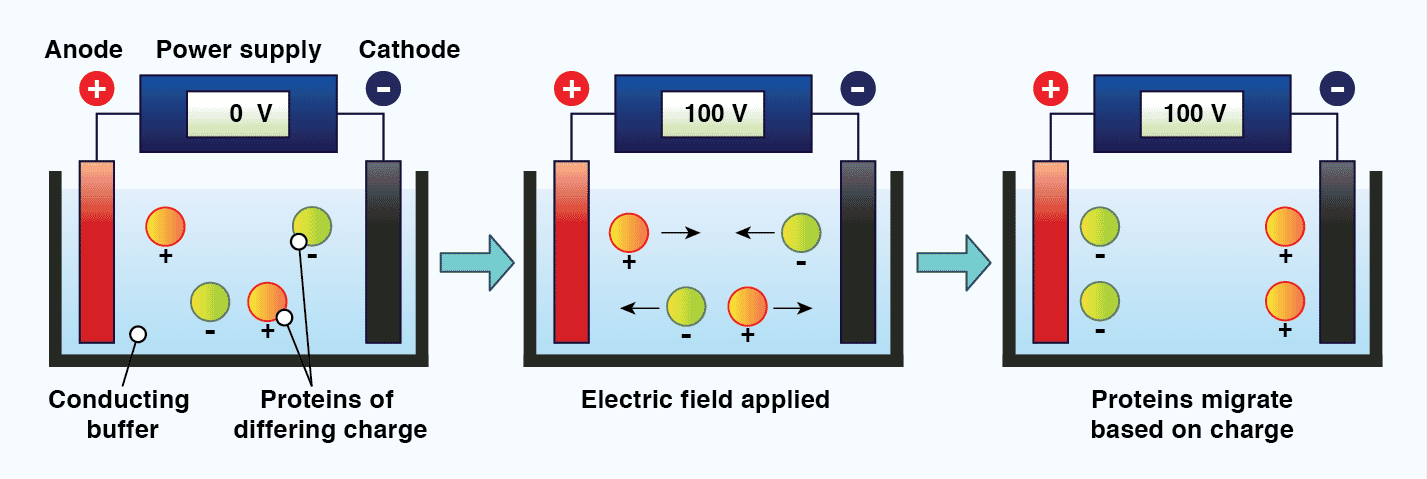
Principles of Electrophoresis
The standard technique used to separate proteins prior to immunoblotting is called discontinuous polyacrylamide gel electrophoresis (PAGE). Electrophoresis refers to the movement of charged particles in an electric field, and requires two electrodes of opposite charge (anode and cathode) separated by a conducting medium (the buffer). When charged molecules, such as proteins and DNA, are exposed to an electric field under these conditions, they migrate towards the electrode with their opposite charge.[11] The mobility of molecules in gel electrophoresis is dictated by the molecules charge, size, and shape, as well as the electrophoresis conditions. These include the ionic strength, pH, and composition of the buffer, the strength of the electric field, and the properties of the gel. A gel is used during protein electrophoresis to act as a size-selective sieve; facilitating protein separation based on molecular weight. The gel is typically mounted vertically between two buffer chambers and connected to electrodes. It is crucial that samples are loaded evenly across the gel, and that sample buffer is included in all wells, including those without sample, to ensure electrophoresis proceeds correctly.
Figure 2: The principle of electrophoresis. When charged particles in a conducting medium are placed in an electric field, they will migrate towards the electrode with their opposing charge.
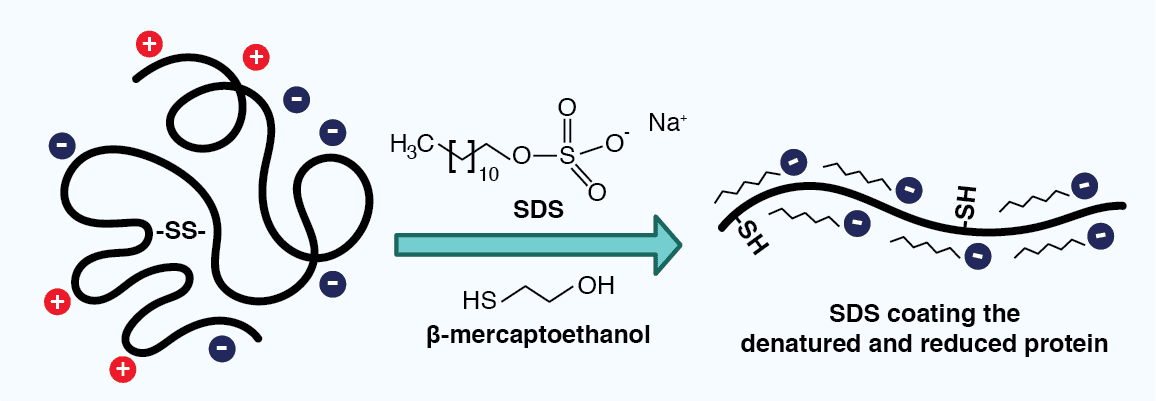
Purpose of SDS in SDS-PAGE
In the case of electrophoresis containing sodium dodecyl sulfate (SDS) and a reducing agent, also known as SDS-PAGE, proteins are separated based only on their mass. The anionic detergent SDS serves two roles: it denatures the proteins in the sample and it binds to their polypeptide backbones, providing them with a uniform negative charge and a similar charge to mass ratio (~1.4 g SDS binds to 1 g polypeptide). The reducing agent additionally breaks disulfide bonds in the proteins, further disrupting protein structure and imbuing the resulting polypeptides with a similar elongated shape. As all of the SDS-polypeptide complexes thus carry a negative charge, their migration in an electric field toward the positive electrode is limited by their size, where smaller molecules will migrate faster than larger ones.
Figure 3: Sodium dodecyl sulfate (SDS) coating a polypeptide. SDS is added to a lysate sample to help denature proteins, as well as provide them with a uniform negative charge and similar 3D structure. A reducing agent, such as β-mercaptoethanol, reduces disulfide bonds, further disrupting the protein structure.
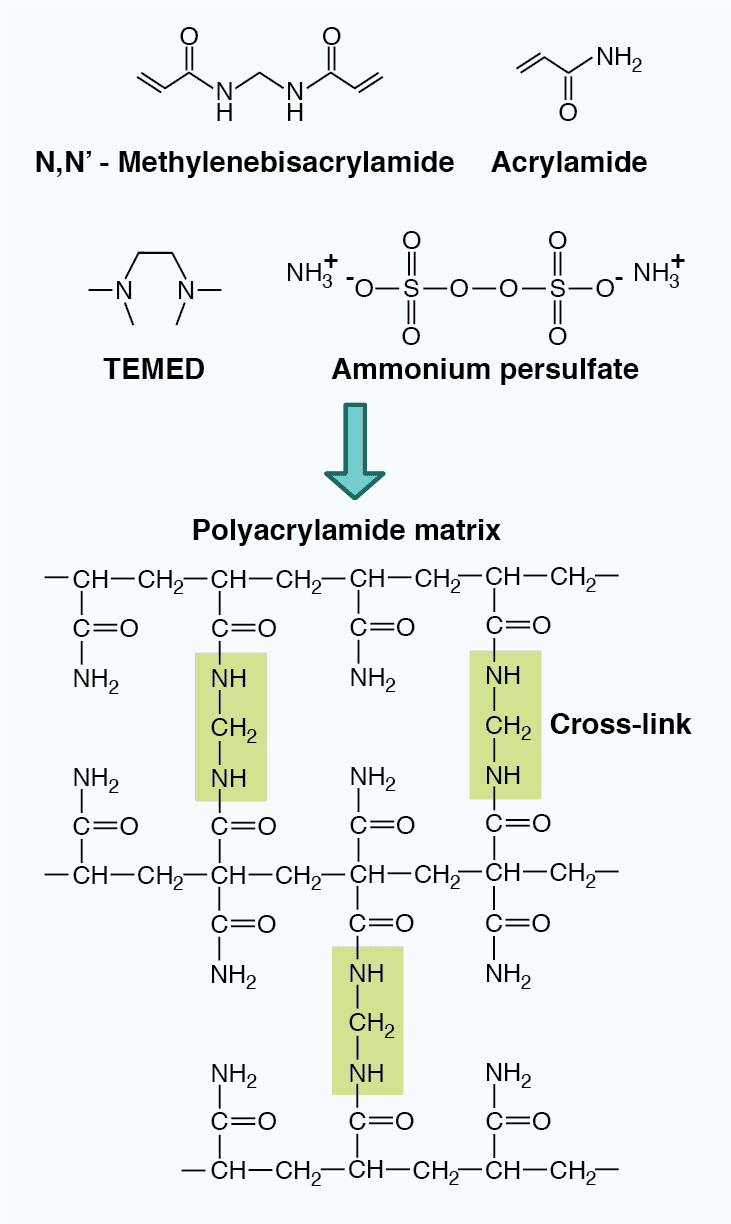
Properties of Polyacrylamide Gels
The properties of the gel also impact the mobility of the SDS-polypeptide complexes. PAGE gels are composed of an inert acrylamide polymer network with a defined pore size, and are made through the crosslinking of acrylamide and bisacrylmide upon the addition of the polymerizing agent ammonium persulfate (APS) and the catalyzing agent N,N,N’,N'-tetramethylenediamine (TEMED). The pore size can be adjusted by altering the polyacrylamide concentration in the gel (Table 4). Low percentage gels have large pores, allowing most proteins to pass through, and can therefore resolve high molecular weight proteins. In contrast, high percentage gels have small pores, severely restrict passage of large proteins, and are therefore better for resolving low molecular weight proteins. In addition, gradient gels provide a range of polyacrylamide concentrations within one gel, allowing proteins of varying size to be resolved simultaneously.
Figure 4: The chemical structure of a polyacrylamide matrix. Polyacrylamide gels are made from crosslinked acrylamide and bisacrylamide following the addition of the polymerizing agent ammonium persulfate and the catalyzing agent TEMED.
| Protein Size Range | Recommended Gel Percentage |
|---|---|
| 4 – 40 kDa | 20% |
| 12 – 45 kDa | 15% |
| 10 – 70 kDa | 12.5% |
| 15 – 100 kDa | 10% |
| 25 – 100 kDa | 7.5% |
Table 4:Recommended gel percentages for different protein size ranges.
Other Forms of PAGE
In addition to SDS-PAGE, a nondenaturing form of electrophoresis called native-PAGE can also be used to separate proteins. Native-PAGE separates proteins based on their mass/charge ratio and shape, and can thus provide information about protein complexes. A third form of electrophoresis called two-dimensional PAGE (2D-PAGE) separates proteins along two dimensions. In the first dimension, they are separated based on their isoelectric point, the pH at which they carry no net charge, using isoelectric focusing. In the second dimension, they are separated by mass. This technique provides more detailed information for proteomics experiments.
Alternative Gel and Buffer Chemistries
Several distinct buffer compositions are used in SDS-PAGE, depending on the particular needs of an experiment. The most common system, described by Ulrich Laemmli[1] in one of the most widely cited papers of all time,[12] is the inexpensive Tris-Glycine system. Tris-Glycine gels are compatible with SDS-PAGE and native-PAGE, and can resolve a wide range of proteins based on their size. The high alkalinity of Tris-Glycine gels, however, can lead to poor band resolution and can negatively impact downstream applications, such as mass spectrometry.
Bis-Tris gels, using either MES or MOPS buffer, are closer to neutral pH and reduce the risk of protein degradation and modification. As a result, this system produces sharper bands and is ideal for samples with low protein abundance and sensitive downstream applications, such as mass spectrometry and analysis of post-translational modifications. MES buffer is better suited for resolving small molecular weight proteins, while MOPS buffer can resolve medium molecular weight proteins.[13]
Tris-Acetate gels are particularly suited for resolving high molecular weight proteins,[14] while Tris-Tricine gels can resolve very low molecular weight proteins.[15]
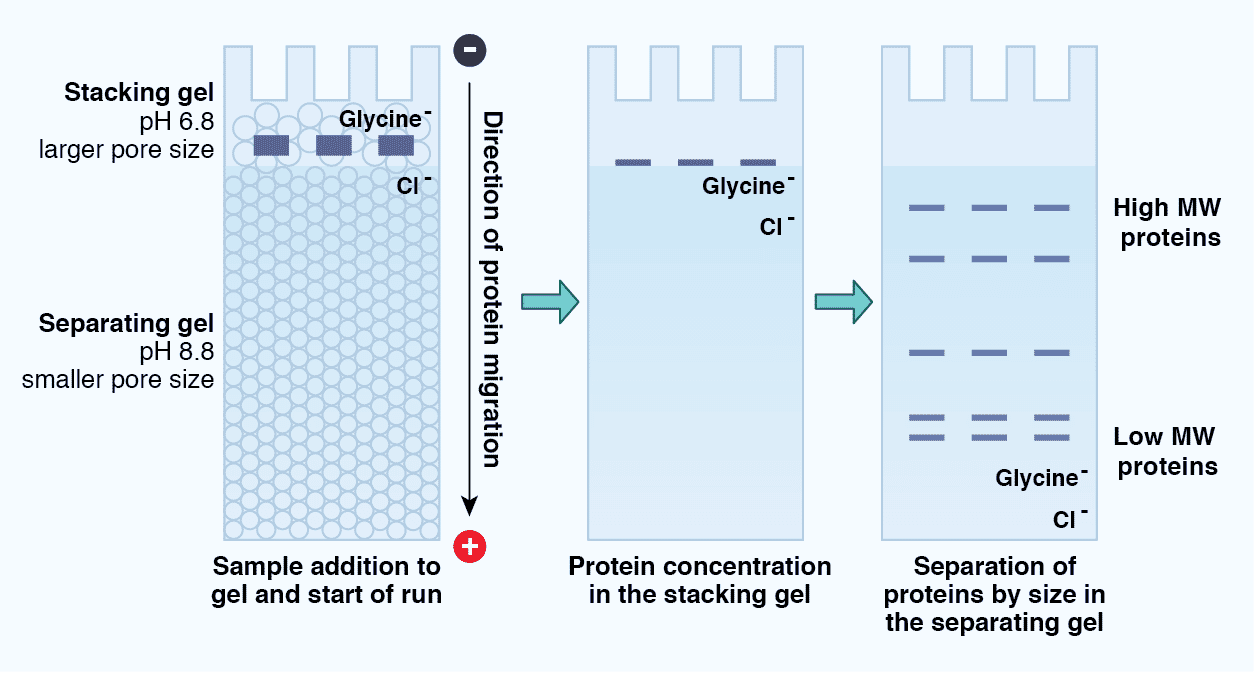
Stacking and Resolving Gels
Tris-Glycine SDS-PAGE is described as a “discontinuous” electrophoresis method because there are two distinct regions within the gel: the stacking gel and the resolving gel (Figure 5). The stacking gel has a lower concentration of acrylamide (4%), a lower pH (6.8 versus 8.8), and a unique ion composition compared to the resolving gel. The protein sample migrates within the stacking gel between a high mobility leading ion (Cl-) front and a low mobility trailing ion (glycine) front under the principles of isotachophoresis (ITP). As a result, the proteins “stack”, concentrating into a tight band before moving into the resolving gel. This promotes the formation of sharp protein bands and reduces protein aggregation. Once the proteins enter the resolving gel, the chemical properties of which more closely match those of the running buffer, the proteins “destack” and migrate according to the principles of zone electrophoresis. The electrophoretic mobility of the proteins thus depends on their mass, and the pore size of the gel creates a sieving effect.
Figure 5: Protein migration through a Tris-Glycine SDS-PAGE gel. SDS-PAGE is considered a discontinuous electrophoresis technique, as it uses an inhomogeneous buffer system. These include the stacking gel, which consists of a low pH, low concentration acrylamide region that promotes concentration or “stacking” of the proteins in a sample, as well as the separating gel, which consists of a higher pH, higher concentration acrylamide region that separates the proteins according to size.
Hand-poured vs Precast Gels
Precast gels are widely available in a range of chemistries, percentages, thicknesses, well numbers, and well volumes. While hand-poured gels may be advantageous for labs with unique needs, precast gels are convenient and can reduce experiment-to-experiment variability. This is especially important for quantitative experiments.
Transfer Methods
The proteins separated through gel electrophoresis are next transferred, or blotted, to a solid phase membrane. This process is required because proteins are more accessible to antibodies on the surface of these membranes and PAGE gels are difficult to handle once removed from their casts. The most common method of blotting is through the electrophoretic transfer of proteins from the gel onto the membrane, which is typically done through wet or semi-dry transfer. After transfer, a total protein stain, such as Ponceau S, can be used to visualize the efficiency of the transfer.
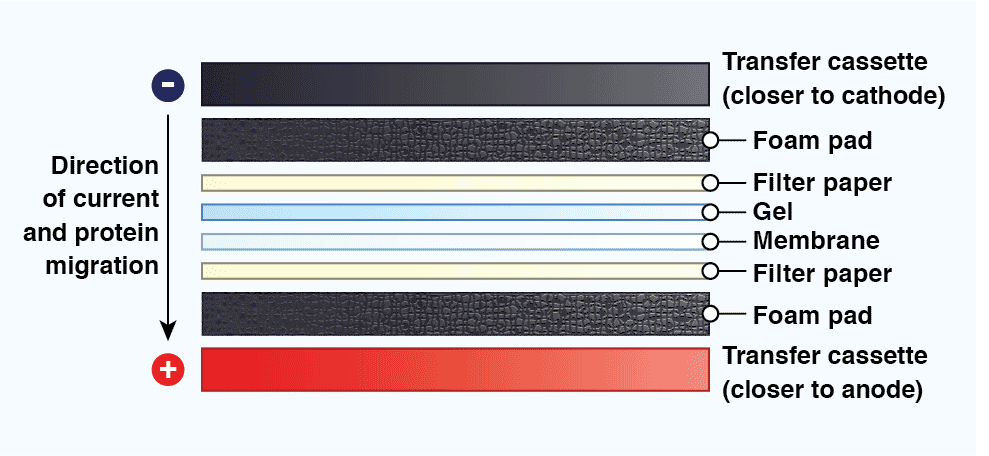
For wet electroblotting, the gel and membrane are sandwiched together, along with absorbent filter paper and sponges, and clamped into a cassette to prevent formation of air bubbles between the gel and membrane. The sandwich is submerged vertically in a conducting transfer buffer and exposed to an electric field. Under these conditions, the negatively charged proteins migrate out of the gel towards the positively charged electrode and become immobilized on the membrane. Wet electroblotting is a high efficiency transfer method that is well-suited for transferring low to high molecular weight proteins (>100 kDa), but is a time-consuming process, typically requiring ~1 hour – overnight.
Semi-dry electroblotting can be completed in 10 – 60 minutes. For this method, the gel and membrane are again sandwiched together with absorbent paper in a horizontal apparatus that is placed in direct contact with electrodes. Semi-dry blotting is better suited to lower molecular weight proteins (<300 kDa), as this technique exhibits reduced transfer efficiency.
Figure 6: The organization of a transfer sandwich for wet electroblotting. During transfer, the negatively charged proteins will migrate out of the gel, toward the positively charged electrode, and onto the membrane.
Membrane Selection
The most common membranes used for immunoblotting are nitrocellulose and polyvinylidene difluoride (PVDF). Nitrocellulose can immobilize proteins and glycoproteins with high efficiency through hydrophobic interactions, but cannot be stripped and reprobed many times due to nitrocellulose’s fragility. Like nitrocellulose, PVDF has a high protein binding capacity, however, PVDF is highly hydrophobic and must be pre-wet with methanol prior to use. As it is less brittle than nitrocellulose, PVDF membranes can be reprobed many times. Both nitrocellulose and PVDF membranes are available in a range of pore sizes. While 0.45 um pore size membranes are generally applicable to most experiments, 0.1 – 0.2 um pore size membranes are more suitable for blotting low molecular weight proteins.
Transfer of Large Proteins
Protein transfer efficiency increases with transfer time and is lower for high molecular weight proteins. There are several ways to increase the transfer efficiency of these proteins. Transfer buffer does not usually contain SDS, as the residual SDS associated with the proteins following gel electrophoresis is sufficient to mediate their electrophoretic migration during transfer. However, the transfer efficiency for large proteins can be increased by adding SDS to the transfer buffer to a final concentration of 0.05 – 0.1%.[16] As methanol serves to remove SDS from proteins during transfer to increase protein immobilization on the membrane, the methanol concentration in the transfer buffer can also be decreased to <10%. In addition, the transfer process can be carried out overnight at 4°C to increase the transfer efficiency, however, smaller proteins can be lost if the transfer process proceeds too long.
Blocking
As the solid phase membranes used in immunoblotting have a high affinity for proteins, antibodies applied to the membrane can adhere to it non-specifically. To prevent this background binding, and to improve the signal-to-noise ratio of the detection step, the membrane must be blocked prior to antibody incubation. The specific reagents used for blocking and the incubation time must be empirically determined. Common blocking agents include non-fat milk and bovine serum albumin (BSA). These can be solubilized in Tris-buffered saline (TBS) or phosphate-buffered saline (PBS), and 0.1% Tween-20 can be added to help prevent non-specific interactions. TBS in particular should be used if the detection method utilizes alkaline phosphatase (AP), as PBS can interfere with AP enzymatic activity. Sodium azide should be not used in buffers if a horseradish peroxidase (HRP) conjugated secondary antibody will be used, as azide inactivates HRP.
Immunodetection of Phosphorylated Proteins
If a membrane will be probed with a phospho-specific antibody, 5% BSA in TBST should be used for blocking. This is because milk contains high levels of the phosphoprotein casein, which will result in a high non-specific background signal if used in combination with a phospho-specific antibody. The results of immunodetection with a phospho-specific antibody should always be compared to an immunoblot showing the total protein levels.
Washing
Between antibody incubation steps, the membrane must be washed with TBS + 0.1% Tween 20 (TBST) or PBS + 0.1% Tween 20 (PBST) to remove unbound antibodies and to reduce the background signal. While too little washing can result in a high background signal, too much washing can reduce the signal-to-noise ratio.
Antibody Incubations
Not all primary antibodies can be used for immunoblotting, depending on the epitope they recognize. Refer to the antibody’s datasheet to ensure it is suitable for immunoblotting. The primary antibody is typically diluted into the wash buffer or the blocking buffer with a slightly decreased blocking agent percentage to help reduce non-specific binding. Although the optimum dilution of the antibody must be empirically determined, most antibody datasheets include recommended dilution ranges. The incubation can be carried out in a shallow box, in a tube, or in a heat-sealed plastic bag to decrease the volume of the primary antibody solution and minimize antibody use.
The proteins on a membrane are typically visualized through indirect detection by utilizing a labeled secondary antibody that recognizes the primary antibody based on its host species and isotype. This is in contrast to direct detection, which utilizes a labeled primary antibody. Indirect detection is usually more advantageous than direct detection. Multiple secondary antibodies bind to one primary antibody, leading to signal amplification. In addition, secondary antibodies are more versatile, as they can be used with many different primary antibodies.
Detection
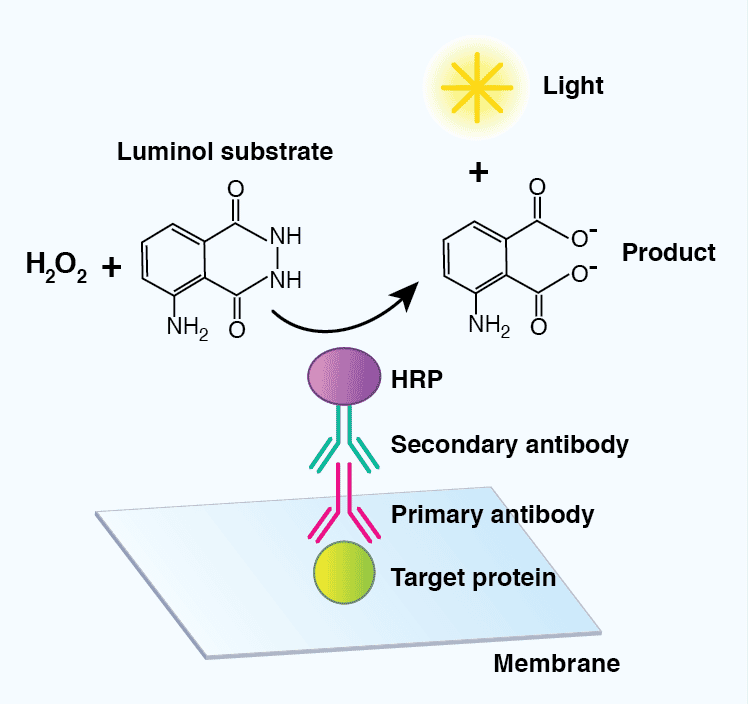
The most common detection method uses enzyme-conjugated secondary antibodies in combination with a chemiluminescent, chromogenic, or fluorescent substrate. HRP-labeled secondary antibodies are widely available at low cost, are stable, and exhibit high enzymatic activity over a defined amount of time. AP- conjugated antibodies are also used to a lesser extent. Luminol and acridan-based substrates can be converted by HRP into chemiluminescent products, which can immediately be detected. Most chemiluminescent substrates are available with varying levels of sensitivity and can be used to enhance the signal in cases where the levels of the target protein are low.
Chemiluminescent substrates are compatible with digital imaging, which allows for quantitative western blotting. A CCD camera-based imaging system, enclosed in a dark cabinet, is typically used for this purpose. Fluorescently labeled secondary antibodies can provide a brighter signal and allow detection of more than one protein at a time but require expensive specialized imaging equipment.
Figure 7: Detection of target proteins using a chemiluminescent-based substrate. A horseradish peroxidase (HRP)-conjugated secondary antibody will convert luminol in the presence of hydrogen peroxide (H2O2) to a chemiluminescent signal and a breakdown product (3-aminophthalate), mediating visualization of a target protein.
Data Analysis and Quantitative Western Blot
Densitometry analysis of immunoblots can be performed using image-processing software. However, a number of factors must be taken into consideration when designing a quantitative immunoblot experiment. The proper amount of sample must be loaded on the gel to prevent signal saturation; this can be optimized by creating a standard curve of the protein loaded versus the band density for a target protein. An appropriate loading control must be used to compare samples across a blot. It is becoming more common to use total protein staining to normalize loading between samples, as opposed to using “housekeeping proteins”.[17] A number of detailed protocols for quantitative immunoblotting have been published.[18-20]