Heather Van Epps, PhD | 19th June 2025
Dendritic cells (DCs) are professional antigen-presenting cells that specialize in kick-starting primary immune responses. Discovered in 1973 by Ralph Steinman and Zanvil Cohn and named for their characteristic shape with elongated dendrites, DCs are highly phagocytic innate immune cells that rapidly recognize and capture antigens from foreign invaders or damaged host cells, and process them for presentation by T cells.1,2
DCs are now understood to be a network of diverse cells with the capacity to induce immune activation (both beneficial and detrimental) or immune tolerance depending on the type, maturation state, and location of the DCs, the nature of the pathogen or antigen, and microenvironmental cues.2-4 Different subsets of DCs are functionally specialized to respond to specific classes of pathogen and to shape the functional characteristics of the T-cells they activate.
The absence or near absence of DCs — for example, caused by mutations in key transcription factors like IRF8, GATA2, or STAT3 — results in profound immunodeficiency and severe susceptibility to infection.5 Functional impairments in DCs have been associated with a variety of inflammatory and autoimmune diseases, including cancer, inflammatory bowel disease, psoriasis and type 1 diabetes, illustrating the fundamental role of DCs in immunity and disease.3,6
No protein marker is unique to DCs, and no single marker is universally expressed on all DCs,7 but markers commonly used to identify dendritic cell subsets are included below. Some are expressed across many DC subsets, such as CD11c, an integrin molecule involved in phagocytosis, and major histocompatibility class II (MHC II), a transmembrane glycoprotein that presents peptide antigens to T cells.7 Others are predominantly expressed by specific DC subsets.
Figure 1: IHC of human tonsil stained with Anti-CD11c Antibody [ITGAX/1242] (A249072).
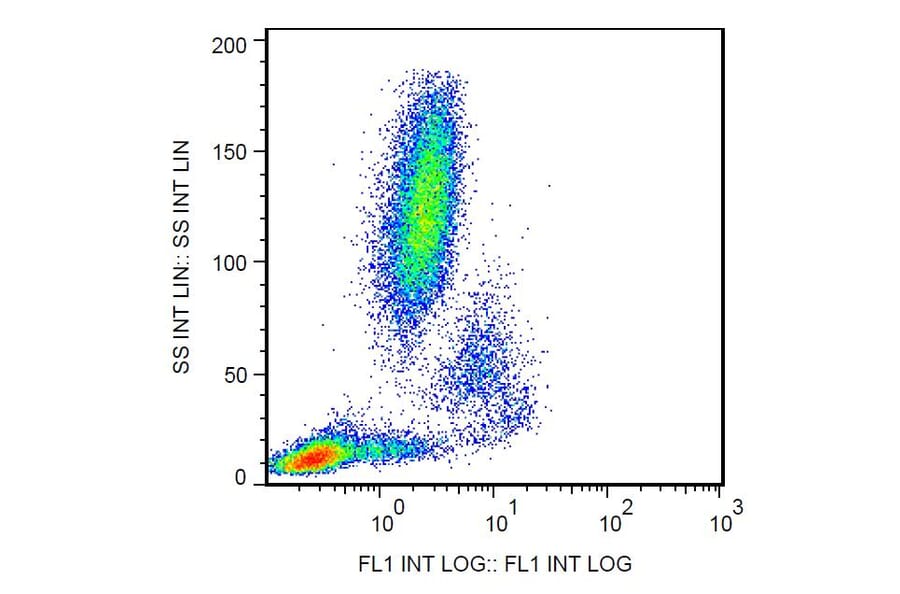
Figure 2: Flow cytometry analysis of human peripheral blood cells stained with Anti-CD11c antibody (A86671).
Notably, all of these markers are expressed by a variety of other cells types, including monocytes, macrophages, and T cells. In addition, there is no consensus on definitive markers of DC subsets, and published studies have used different complements of surface markers to identify the same subsets, depending on variables such as species, tissue, and simple preference.
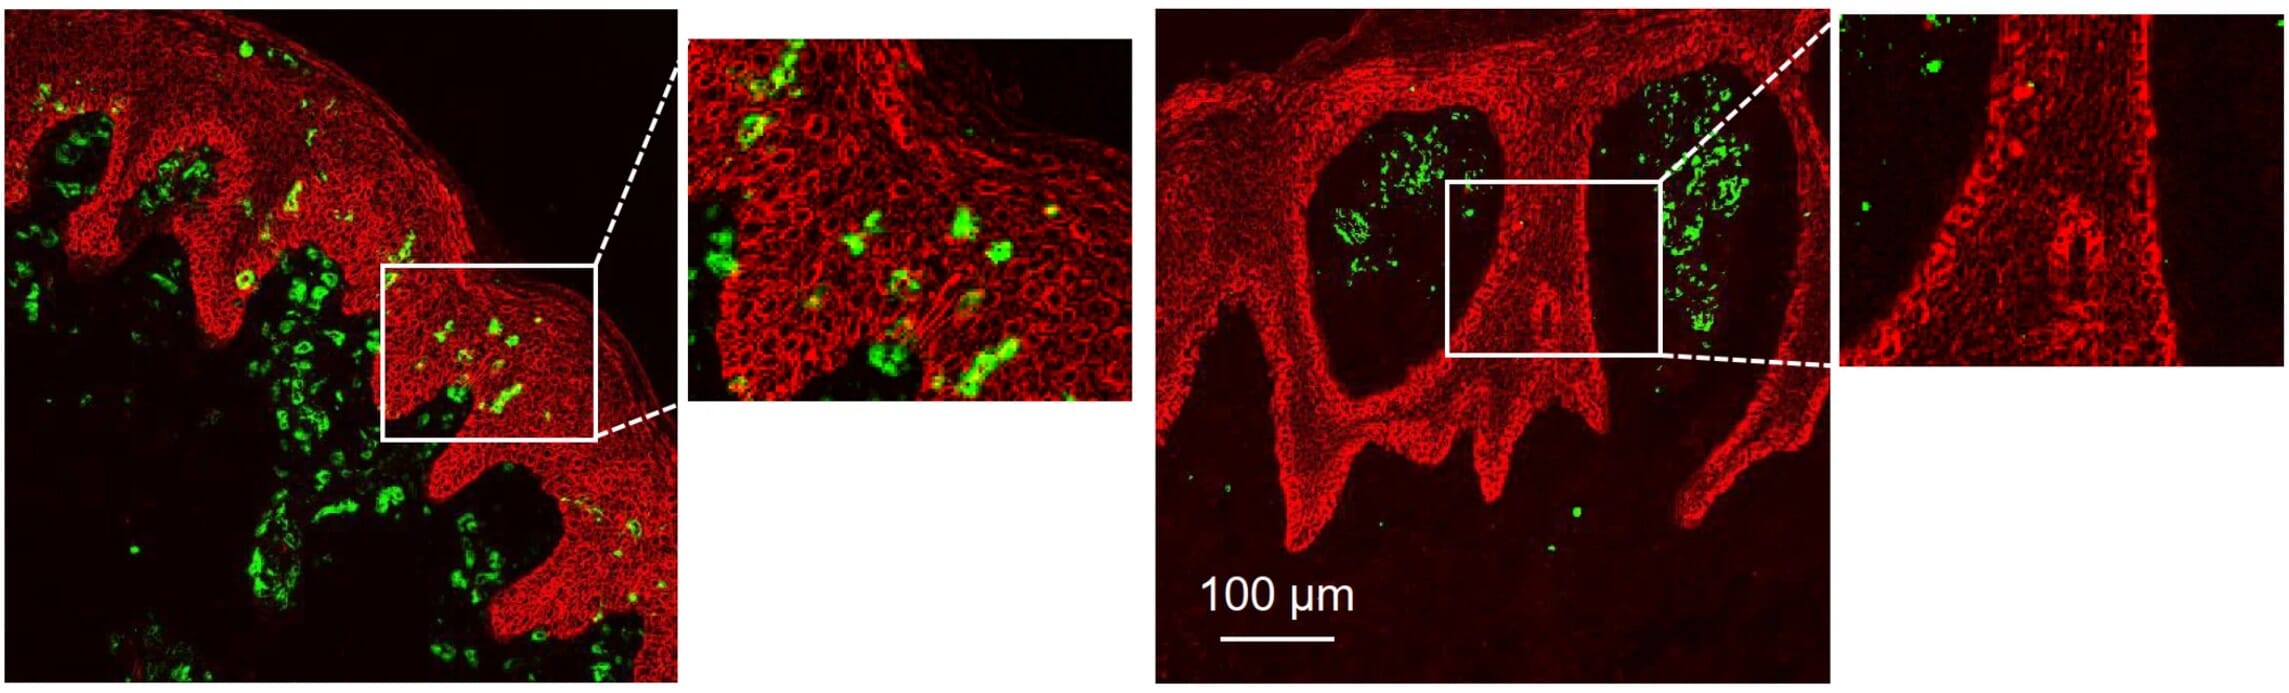
As a result of their heterogeneity, DC populations are typically identified by a combination of surface markers using techniques including flow cytometry, IF, and IHC, as well as more recently developed techniques such as multiplex imaging.8 These techniques, along with new computational tools, allow researchers to study the role and localization of DCs in blood and tissues, such as defining their roles and unique spatial distribution in the skin diseases psoriasis and atopic dermatitis (Figure 3).3
Figure 3: Immnofluorescence staining of human dendritic cells with Anti-CD11c (green), showing their distinct localization in skin of patients with atopic dermatitis (left) or psoriasis (right). Edited and reproduced under Creative Commons 4.0 CC-BY from 3.
DCs are found in blood and most tissues of the body—particularly those that interface with the external environment such as skin, gut, and respiratory tract. Here, they monitor for invading pathogens, present antigen fragments to T cells, and produce cytokines and other soluble mediators that modify the local tissue environment and the cellular and functional characteristics of the adaptive immune response.
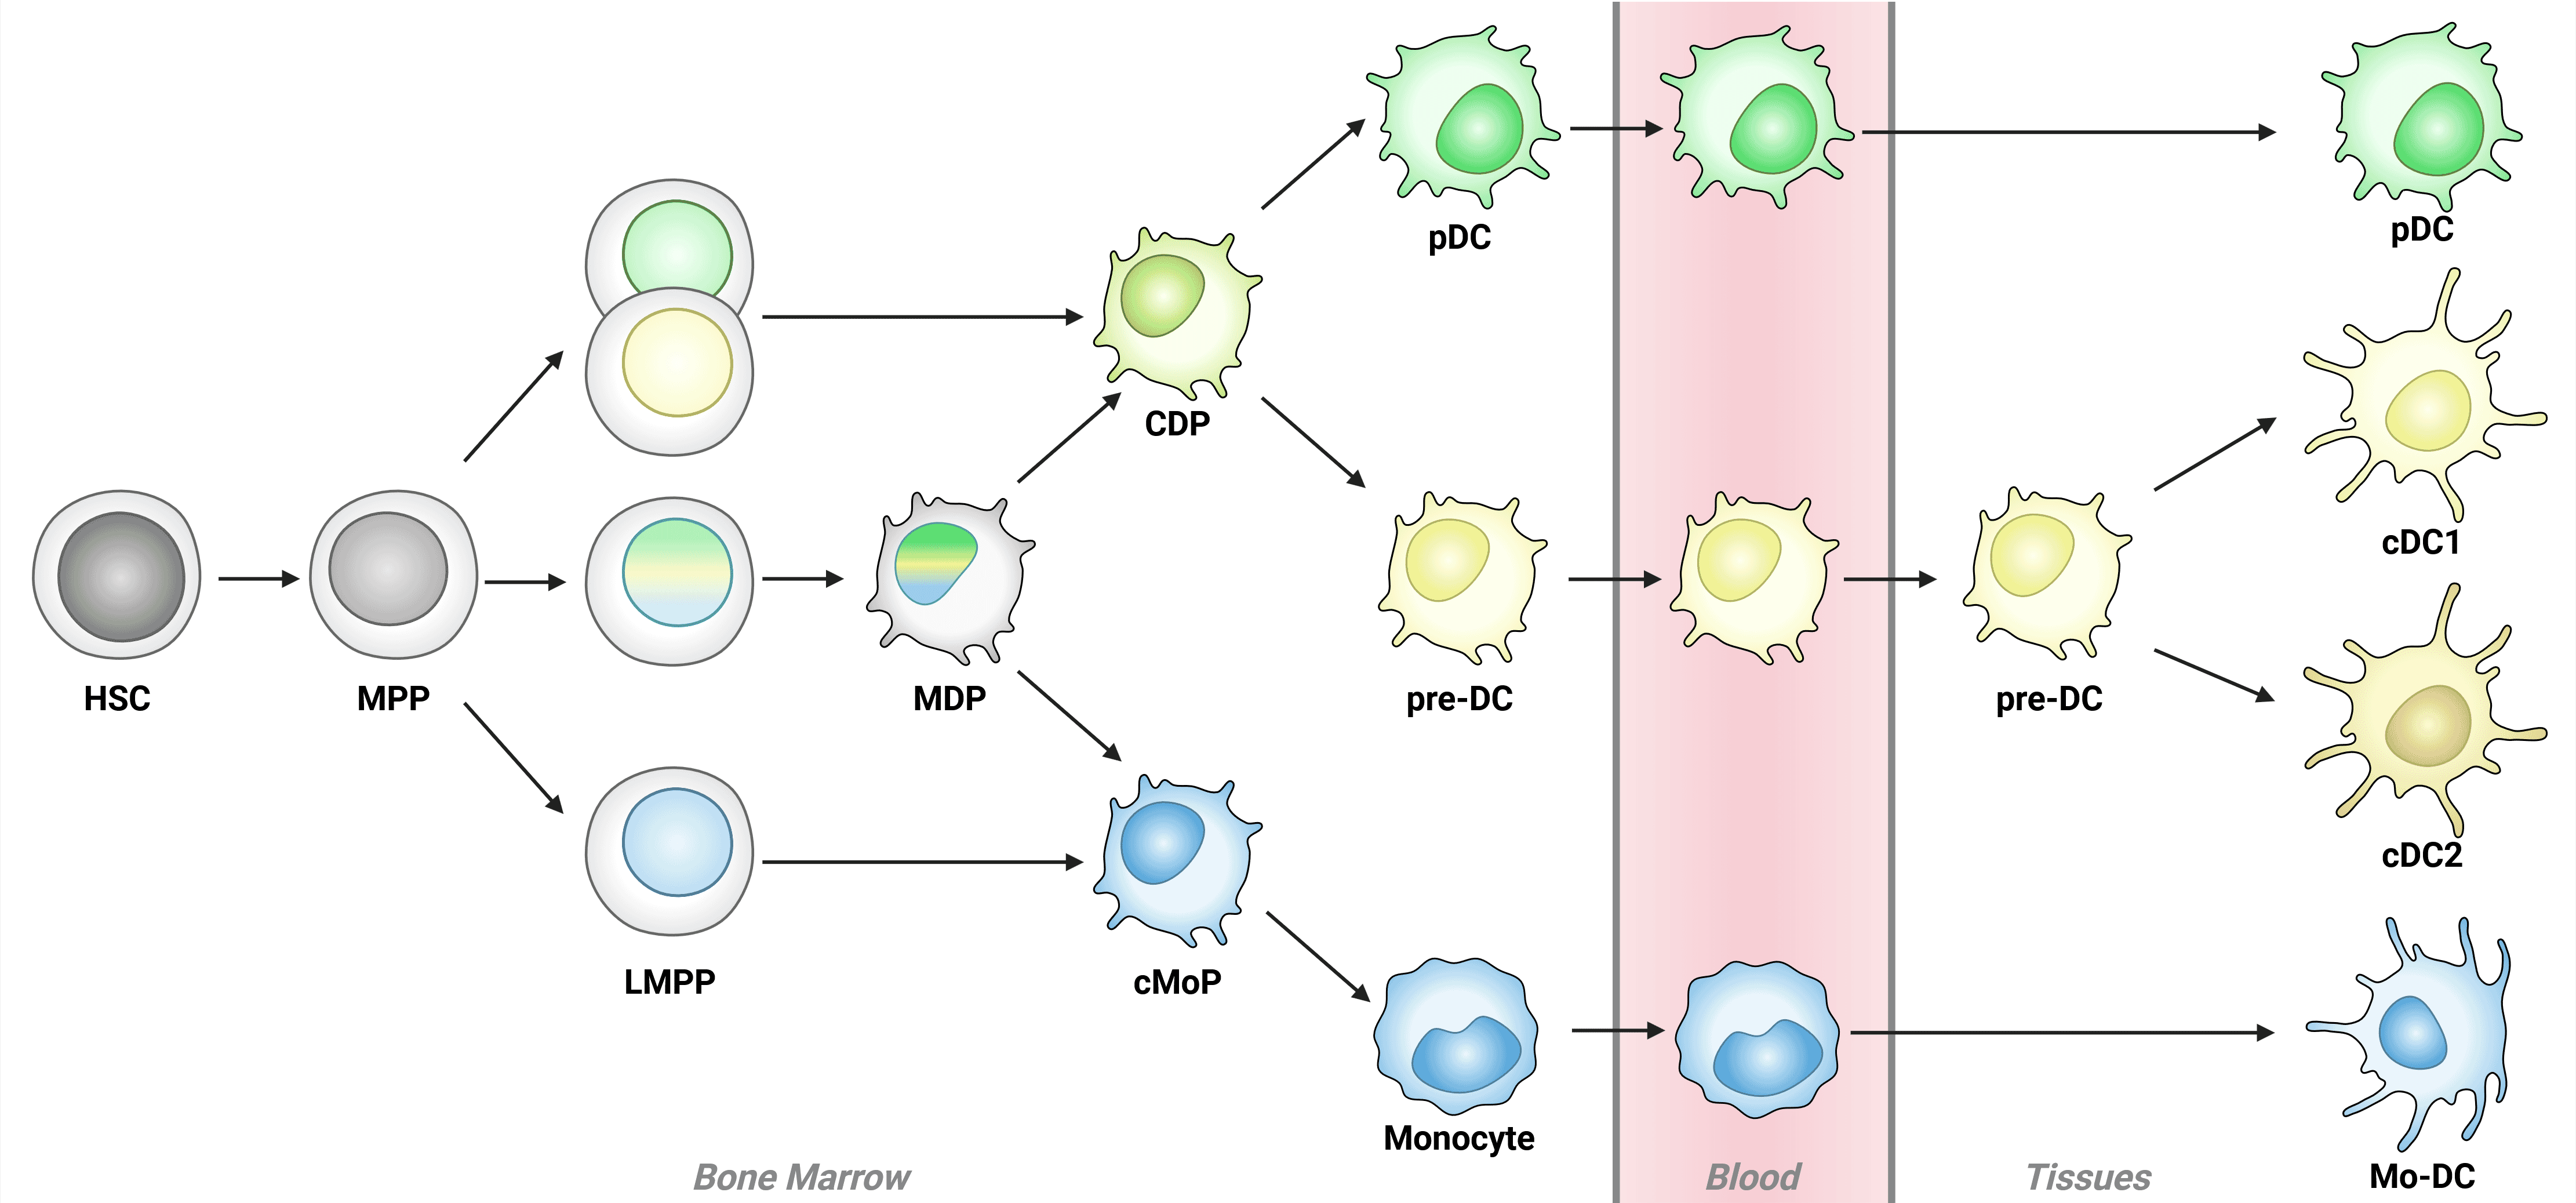
Most DCs arise from hematopoietic stem cells in the bone marrow that differentiate in sequential steps, culminating in the differentiation of common DC progenitor (CDP) cells, which give rise to plasmacytoid DC (pDCs) and pre-DCs. Pre-DCs then differentiate into conventional DCs (cDC1 and cDC2; Figure 4).2,7
Figure 4: Schematic of dendritic cell development Schematic of dendritic cell development in the bone marrow. DC development begins in the bone marrow with hematopoietic stem cells (HSCs), which develop into multipotent progenitor (MPPs) and then lymphoid primed multi-potent progenitors (LMPPs). While LMPPs are considered multi-potent, individual LMPPs often demonstrate lineage bias towards either common DC progenitors (CDPs) or common monocyte progenitors (cMoPs), indicated by single color nuclei. Truly multi-potent LMPPs (tri-color nuclei) may progress to CDP or cMoP stage via macrophage DC progenitors (MDPs). Plasmacytoid DCs (pDCs) and monocytes complete development in the bone marrow, while conventional DCs (cDCs) and monocyte-derived DCs (mo-DCs) complete differentiation in tissues. Adapted from 21.
Throughout development, dendritic cell progenitor populations can be identified by expression of CD45RA and CD38, with expression of other markers depending on developmental fate, environment and activation state. For example, CD123 and CD303 are expressed at the pre-DC state, with expression maintained on plasmacytoid DCs (pDCs) but not conventional DC (cDC) populations.
A distinct population of DCs arises from monocytes (mo-DCs) in peripheral tissues and lymph nodes at steady state and in response to infection or inflammation. However, whether these cells represent a distinct lineage or a distinct activation state of a common monocytic cell remains unclear.9
A summary of commonly used mouse and human DC markers is shown in Table 1 and Table 2. Dendritic cells also express a variety of pathogen recognition receptors (eg, Toll-like receptors, lectins) and chemokine receptors, which are involved in responses to infection and cell damage and migration to different tissues.
| cDC1 | cDC2 | pDC | LCs | Mo-DC | |
|---|---|---|---|---|---|
| CD8a | High | – | – | – | – |
| XCR1 | High | – | – | – | – |
| CD370 (CLEC9A) | High | – | – | – | Low/– |
| CD141 (BDCA-3/Thrombomodulin) | High | Low/– | – | Low/– | Low/– |
| CD103 (αE integrin) | High | Low/– | – | Pos | – |
| CD205 (DEC205) | High | Low/Pos | Low/– | Pos | – |
| CD11b | Low/– | High | – | Pos | High |
| CD172a (SIRPα) | Low/– | High | – | Pos | Pos |
| CD1c (BDCA-1) | – | High | – | Low/– | Low/– |
| CD135 (Flt3) | Pos | Pos | Pos | Low/– | – |
| CD11c | High | High | Low/– | Pos | Pos |
| MHC II (HLA-DR) | High | High | Pos/High | High | High |
| CD123 | Low/– | Low/– | High | – | Low/– |
| CD303 (BDCA-2/CLEC4C) | – | – | High | – | – |
| CD317 (PDCA-1) | – | – | High | – | – |
| CD1a | – | Low/– | – | High | Low/– |
| CD207 (Langerin) | Low/– | – | – | High | – |
| CD326 (EpCAM) | Low/– | Low/– | – | High | – |
Table 1: Expression differences of surface markers commonly used to identify dendritic cell subsets in humans and mice. Markers are approximately clustered by expression profile, though few markers are available that exclusively mark a specific population. Pos: positive; – indicates no detectable expression.
While DCs have historically been classified based on their function or anatomical location (both of which remain useful to provide context to studies), gene expression profiling has created a set of robust DC groups based on lineage, driven by the expression of specific transcription factors such as IRF4 and IRF8.7 This classification is also relatively consistent across species. Table 2 depicts classical and novel markers identified by transcriptomics, including both surface markers and intracellular markers, that can be used to distinguish between DC subsets.
| Subset | Differential Transcription Factors | Classical Markers | Extended Markers |
|---|---|---|---|
| pDC | E2-2 (TCF4) ZEB2 IRF8 IRF4 | CD123 CLEC4C (CD303) CD317 (PDCA-1) Neuropilin-1 (CD304) | FCER1 ILT3 ILT7 DR6 |
| Pre-DC | ZEB2 IRF4 KLF4 | CD123 CLEC4C (CD303) | AXL SIGLEC 6 CX3CR1 CD169 (SIGLEC 1) CD22 (SIGLEC 2) CD33 (SIGLEC 3) |
| cDC1 | ID2 IRF8 BATF3 | CD141 (Thrombomodulin) CD1c (BDCA-1) | CLEC9A CADM1 XCR1 BTLA CD26 CD226 (DNAM-1) |
| cDC2 | ID2 ZEB2 IRF4 KLF4 | CD1c (BDCA-1) CD11b CD11c CD14 CD33 | CD2 FCER1 SIRPA ILT1 CLEC4A CLEC10A |
| Langerhans Cell | ID2 RUNX3 | CD207 CD1a E-Cadherin | EpCAM TROP2 |
| Mo-DC | MAFB KLF4 | CD1a CD1c (BDCA-1) CD11c | SIRPA S100A8 S100A9 CD206 DC-SIGN (CD209) |
Table 2: Extended markers of human dendritic cell subsets. Pre-DC refer to the immediate precursors to conventional DCs. cDC, conventional DC; DC, dendritic cell; Mo-DC, monocyte-derived DC; pDC, plasmacytoid DC. Adapted from 7
Plasmacytoid DCs (pDCs) are highly secretory DCs that reside mostly in lymphoid organs and have a limited lifespan. pDCs are round, lymphocyte-like cells that specialize in producing large amounts of type I interferons in response to viruses.10 These cells are also adept at cross-presenting protein antigens to CD8+ T cells via MHC class I and have been shown to have tumor-promoting and tumor-suppressive properties in various types of cancer.11
Like their cDC counterparts, pDCs express the cytokine receptor CD135 (Flt3), which is essential for their differentiation from precursor cells, but they express lower levels of MHC II at steady-state and do not express CD11c. pDC also express a variety of intracellular protein markers, including the pattern recognition molecules Toll-like receptor-7 (TLR-7) and TLR-9, which are essential for production of type I interferons, and the transcription factors RUNX2, TCF4, IRF4 and IRF8, which are required for pDC differentiation (RUNX2) and function (TCF4, IRF4, IRF8).10-12
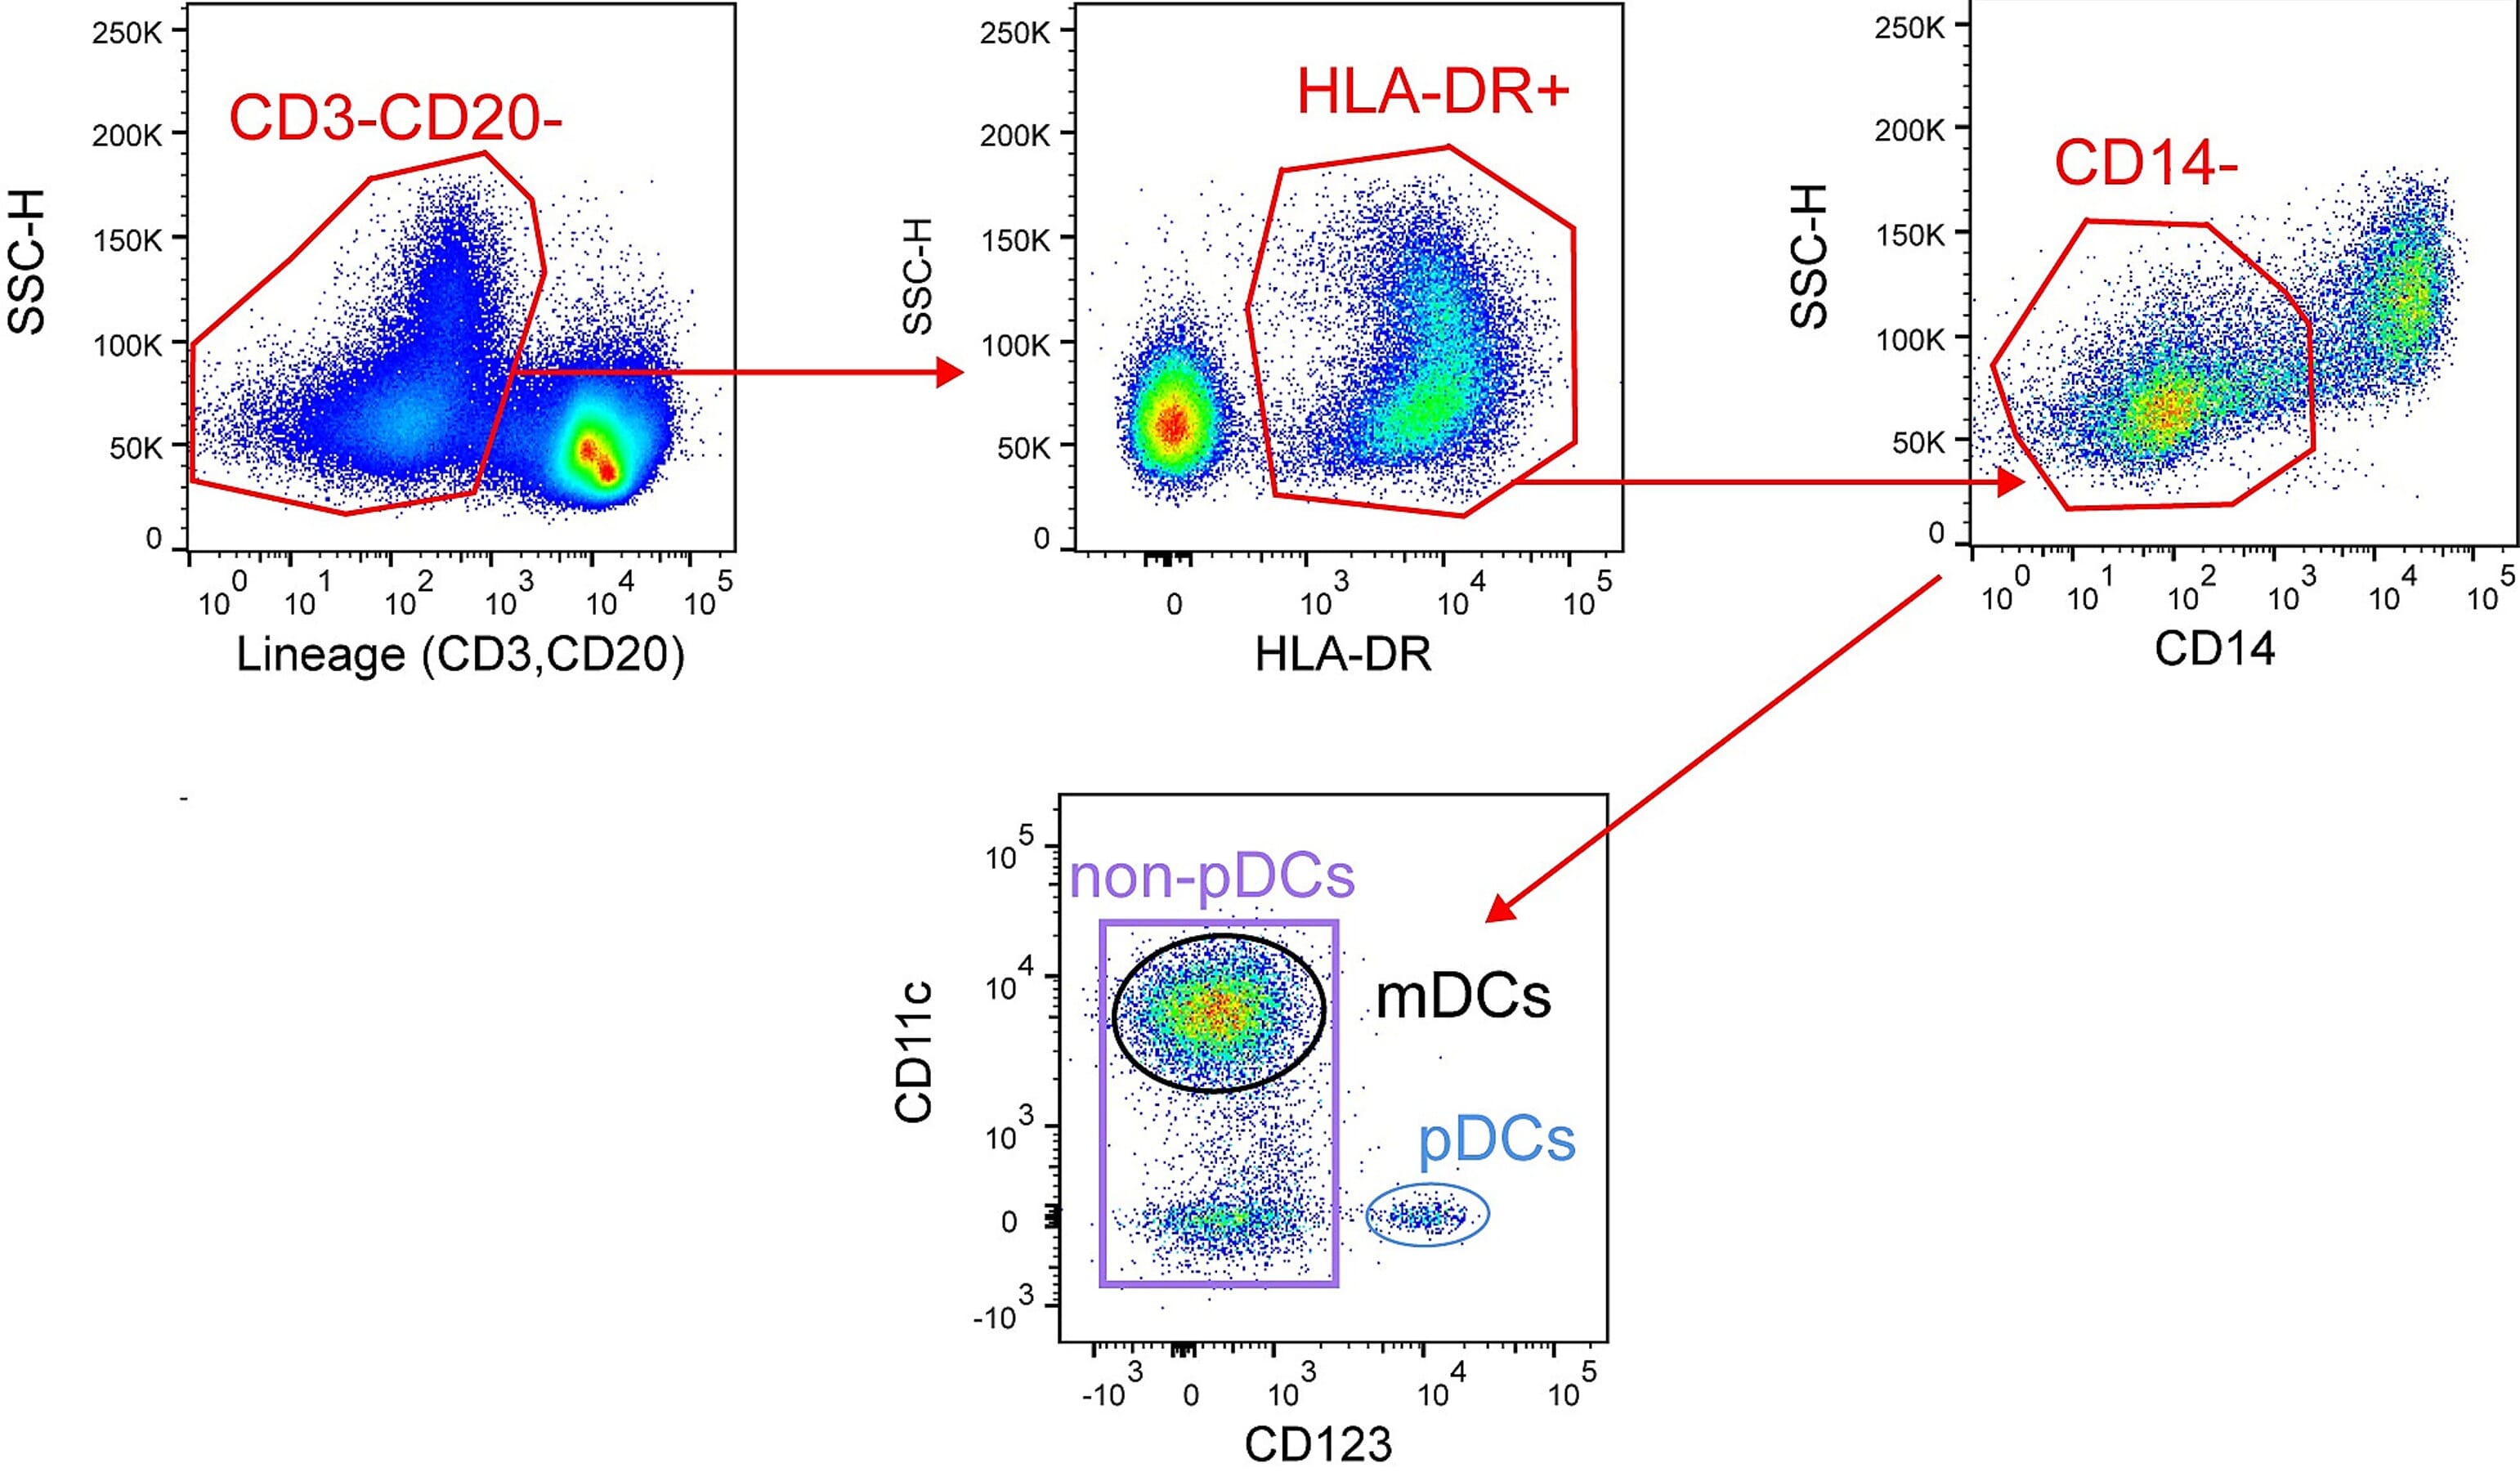
A flow cytometry gating strategy for pDCs is shown in Figure 5.
Figure 5: Flow cytometry gating strategy of live lymphocytes to isolate pDCs. Edited and reproduced under Creative Commons 4.0 CC-BY from 12.
Markers that are commonly used to distinguish pDCs from conventional DC populations are listed below (also see Tables 1 and 2):
cDCs are found in the blood, lymphoid organs, and non-lymphoid tissues such as the skin, lung, liver, and gut. cDCs are divided into two main subsets — cDC1 and cDC2 — which differ in abundance, phenotypic markers, and function. As with other dendritic cell subsets, identification of cDC subsets relies on expression of combinations of cell surface markers as well as intracellular expression of transcription factors and pattern recognition receptors. It is important to note that cDCs can reside in different functional activation states depending on the tissue localization and inflammatory milieu.7,9
cDC1 Markers
The less abundant cDC subset, cDC1s function predominantly to cross-present antigens to CD8+ T cells and natural killer (NK) cells via MHC class I. cDC1s also produce abundant levels of the T helper 1 (Th1)-promoting cytokine interleukin (IL)-12.
Markers commonly used to mark cDC1 populations are listed below (also see Tables 1 and 2):
Figure 6: Flow cytometry analysis of human peripheral whole blood stained with Anti-CD1c Antibody [L161] (APC) (A121893).
Figure 7:IF of human PBMC cells stained with Anti-CD8A Antibody [C8/468] (A250555).
cDC2 Markers
The most abundant subset of DCs, cDC2s are characterized by abundant expression of lectins, TLRs, and NOD-like receptors that endow them with the capacity to respond to a variety of mycobacterial and fungal antigens. cDC2s can stimulate the gamut of polarized CD4+ Th responses (Th1, Th2, Th17, Th22), depending on the cytokines they release, which in turn is dependent on the extracellular milieu (e.g. type of stimulation, cytokines), and also have the capacity to cross-present antigens to CD8+ T cells. Different sub-populations of cDC2 have been identified in humans: CD5high ‘DC-like’ cDC2 cells (also called DC2s) that preferentially prime Th2, Th17 and regulatory T cells, and CD5low ‘monocyte-like’ cDC2s (also called DC3s), which mostly prime Th1 responses.7
Markers commonly used to mark cDC2 populations are listed below (also see Tables 1 and 2):
Figure 8: Flow cytometry analysis of human peripheral whole blood stained with Anti-CD11b Antibody [ICRF44] (PE-Cyanine 7) (A121977).
Figure 9:Flow cytometry analysis of THP-1 cells stained with Recombinant Anti-SIRP alpha Antibody [DM8] - BSA and Azide free (A318677) (left) or an isotype control antibody (right).
In peripheral tissues, particularly mucosal tissues, monocytes can give rise to dendritic cells in response to inflammation and at steady state.13 Markers expressed by these monocyte-derived DCs (mo-DCs) include those that reveal their monocytic origin (eg, CD14, CD64, Ly6C, CCR2) and others that reflect their DC status (CD11b, CD11c, CD172a).7 While mo-DCs are relatively poorly understood compared to other DC subsets and so lack definitive markers, some putative mo-DC markers include CD209, CD206, CD207, CD208, and CD303.14,15
Mo-DCs are also readily induced in vitro by treating blood monocytes with the cytokines GM-CSF and IL-4—a process that requires the induction of the transcription factor IRF-4 downstream of aryl hydrocarbon receptor (AHR). Many phenotypic and functional features of mo-DCs, including their ability to present antigen and prime naïve CD4+ T cells, have been described using in vitro culture systems.7 However, in vivo studies have ascribed various properties to these cells—depending on tissue localization and environmental cues—so the precise role of mo-DCs in vivo remains unclear.9,16
A unique and developmentally distinct population of DCs residing in the epidermis, LCs patrol the skin for pathogens, capturing foreign antigen and stimulating adaptive immune responses, both locally and in skin-draining lymph nodes. LCs also have roles in wound healing, skin cancers, and other pathologies of the skin.17 Oncogenic transformation of LCs is thought to underly the skin disease Langerhans histiocytosis.
Unlike other DC populations, LCs arise from primitive myeloid progenitor cells from the yolk sac and fetal liver, and rapidly expand and acquire DC morphology and markers shortly after birth.18 These cells are characterized by expression of the C-type lectin langerin/CD207, which is involved in pathogen recognition and uptake, as well as the invariant MHC class I molecule CD1a, and CD326 (EpCAM) (Table 1). This subset of DCs expresses low levels of CD11c and CD11b.7,17 LCs proliferate in the skin, thereby maintaining their numbers in situ.
Figure 10: IHC of human skin stained with Recombinant Anti-CD1a Antibody [C1A/1506R] (A250475).
Figure 11:IHC of human skin stained with Anti-Langerin Antibody (A329556).
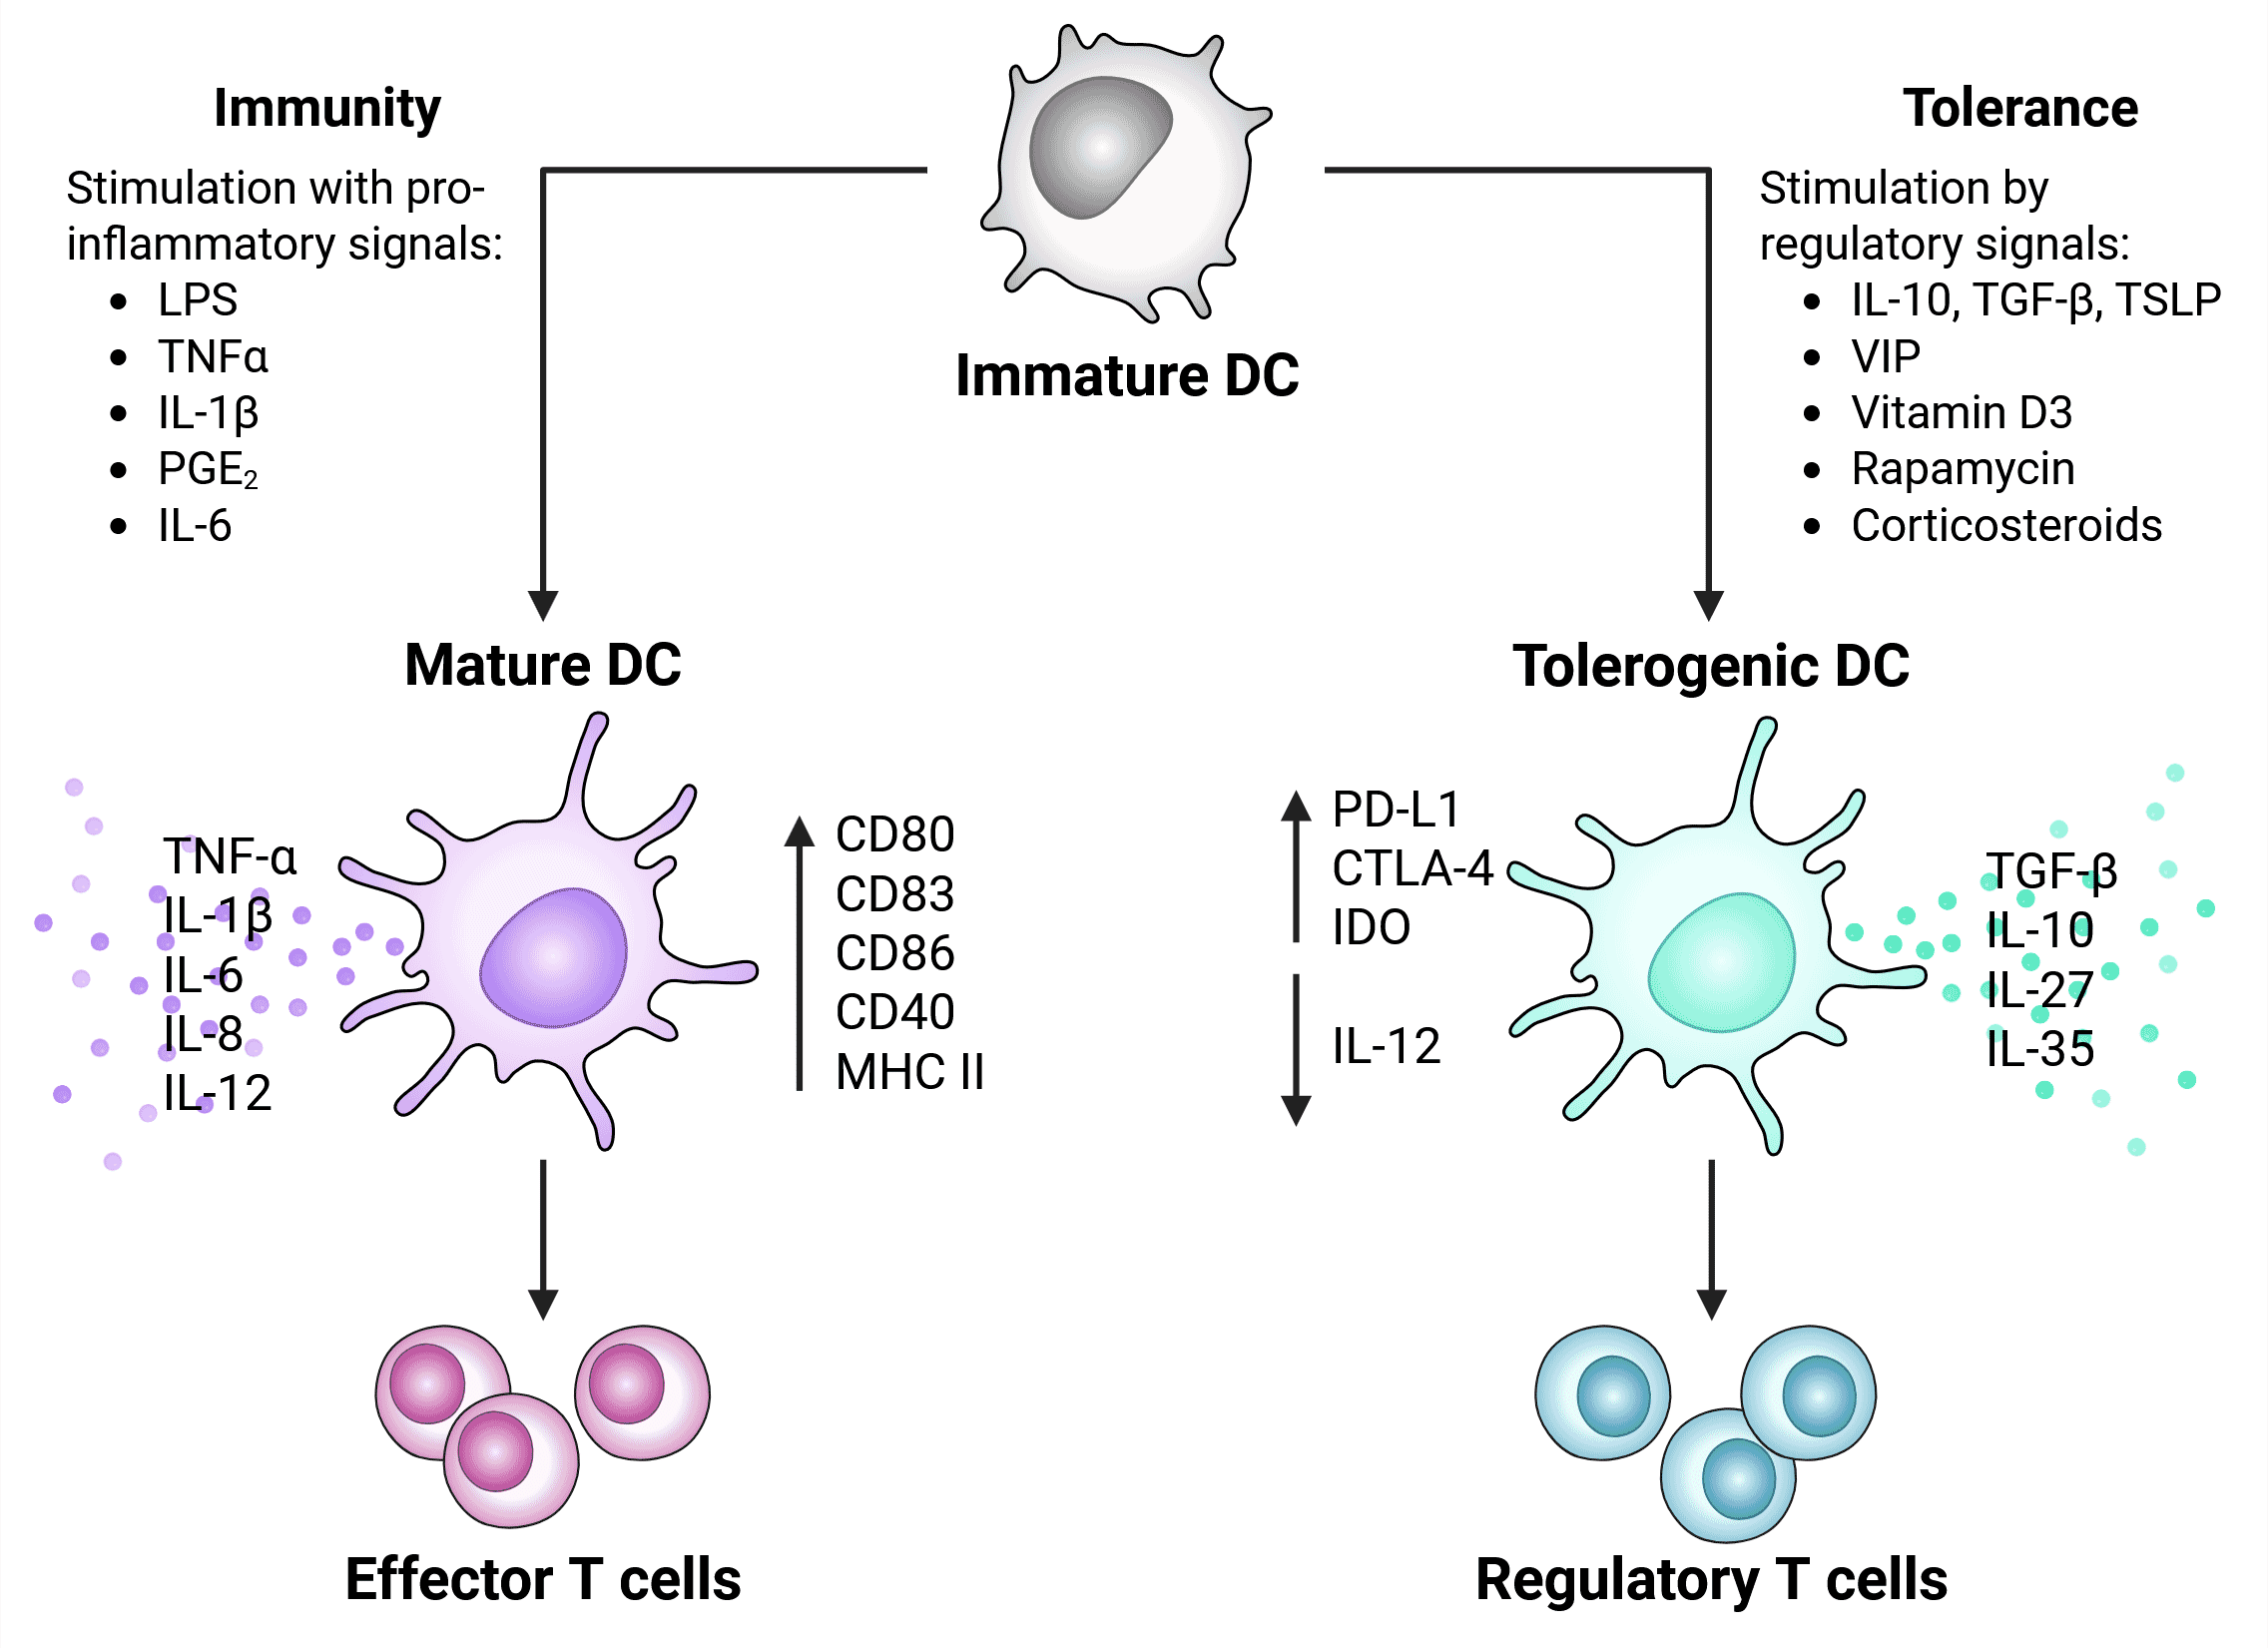
Broadly speaking, DCs reside in an immature state in which they are highly endocytic, express low levels of MHC II, chemokine receptors, and costimulatory molecules (e.g. CD80 and CD86). DCs become activated in response to a variety of signals, upon which they acquire expression of novel surface markers (e.g. CD208, MHCII, CCR7), upregulate costimulatory molecules and pro-inflammatory cytokines, and become less phagocytic. DC activation is required for their functionality, which differs depending on the nature of the stimulus, the tissue environment, and the environmental milieu.2,6
Stimulatory signals/molecules:
In the presence of specific signals, including the cytokines IL-10 and TGFb or immunosuppressive agents like rapamycin, DCs differentiate into tolerogenic cells that preferentially stimulate regulatory T cells and produce anti-inflammatory cytokines (e.g. IL-10; Figure 12). 2,6
Tolerogenic DCs suppress immune responses by a variety of mechanisms such as secretion of cytokines and other mediators to inhibit effector T cell function,19 and these cells play a role in dampening protective T-cell responses in many types of cancer. For example, they express high levels of inhibitory markers such as PD-L1 and CTLA-4, which engage receptors on T cells and suppress their activation.19,20
Figure 12: Activation signals and phenotype of tolerogenic vs immunogenic (mature) DCs. Regulatory factors that stimulation induction of tolerogenic DCs include apoptotic factors, regulatory cytokines, and signals from the tumor microenvironment (such as lactate, VEGF and hypoxia). Adapted from 20.
DC subsets tend to be conserved between humans and mice and often use orthologous markers, although sometimes the markers chosen for flow cytometry panels differ due to expression differences, reagent availability or convention.
| Cell Type | Human Markers | Mouse Markers | |
|---|---|---|---|
| Plasmacytoid DC (pDC) | CD123+, IRF8+ | CD317+, B220+ | |
| Conventional DC1 (cDC1) | CD141+, CLEC9A+, XCR1+ | XCR1+, IRF8+, CD172a- | |
| Conventional DC2 (cDC2) | FcεRIα+, CD1c+ | CD172a+, IRF4+ | |
| cDC2 Subsets | DC2A | CD5+, CLEC10A+ | T-bet+, CD117+, ESAM+ |
| DC2B | CD5+, CLEC4A+ | T-bet-, CLEC12A+ | |
| DC3 | CD5-, CD14+/-, CD163+/- | CD172a+, Ly6c- | |
| Langerhans cells (LCs) | CD1a+, CD207+ | EpCAM+, CD207+ | |
Table 3: Common cell surface and intracellular markers for human and mouse dendritic cells. Data adapted 8
Diagrams created with BioRender.com.
![IHC - Anti-CD11c Antibody [ITGAX/1242] (A249072)](https://cdn.antibodies.com/image/catalog/249/A249072_1.jpg?profile=product_image)
![Flow cytometry - Anti-CD1c Antibody [L161] (APC) (A121893)](https://cdn.antibodies.com/image/catalog/121/A121893_1.jpg?profile=product_image)
![IF - Anti-CD8A Antibody [C8/468] (A250555)](https://cdn.antibodies.com/image/catalog/250/A250555_3.jpg?profile=product_image)
![Flow cytometry - Anti-CD11b Antibody [ICRF44] (PE-Cyanine 7) (A121977)](https://cdn.antibodies.com/image/catalog/121/A121977_1.jpg?profile=product_image)
![Flow cytometry - Recombinant Anti-SIRP alpha Antibody [DM8] - BSA and Azide free (A318677)](https://cdn.antibodies.com/image/catalog/318/A318677_1.png?profile=product_image)
![IHC - Recombinant Anti-CD1a Antibody [C1A/1506R] (A250475)](https://cdn.antibodies.com/image/catalog/250/A250475_1.jpg?profile=product_image)